Use the report tab to analyze and understand single securities.
Use the “Search” input at the top of the screen to search mutual funds and ETFs.
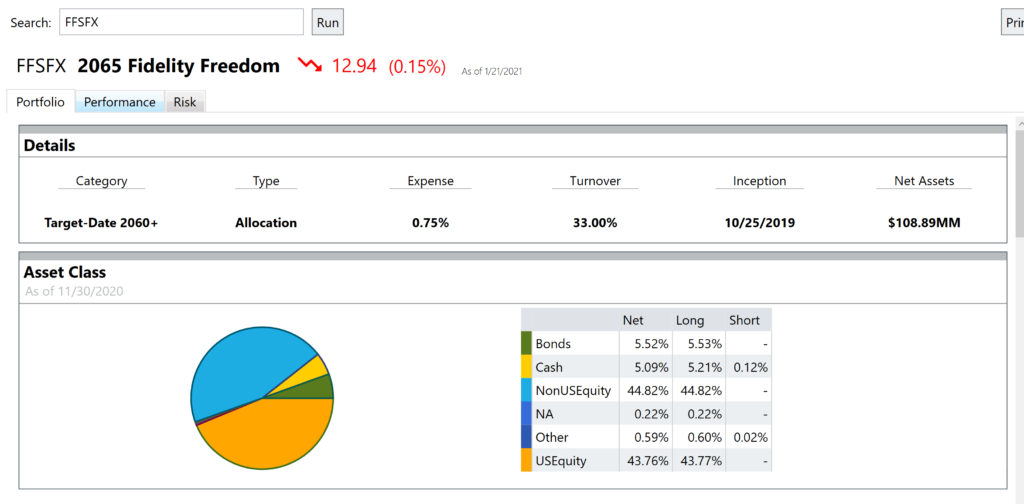
Portfolio Data
The portfolio tab displays the breakdown of a security’s portfolio by:
- Asset Class
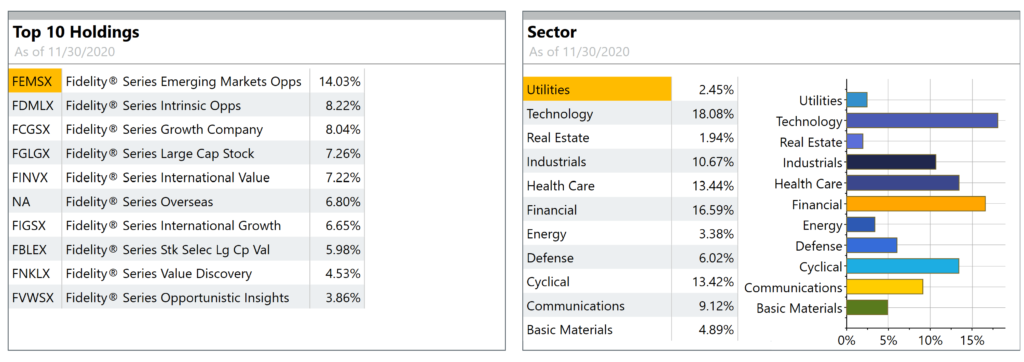
- Sector
- Top 10 Holdings
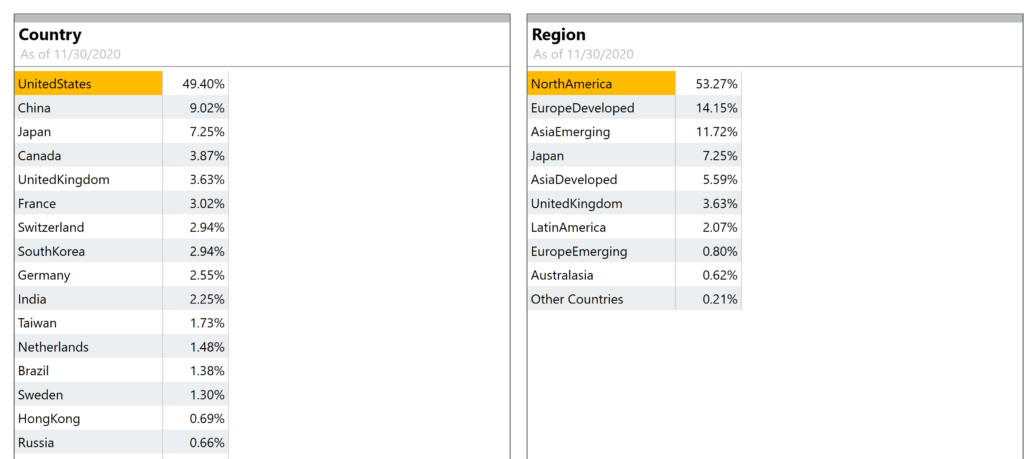
- Region Exposure
- Country Exposure

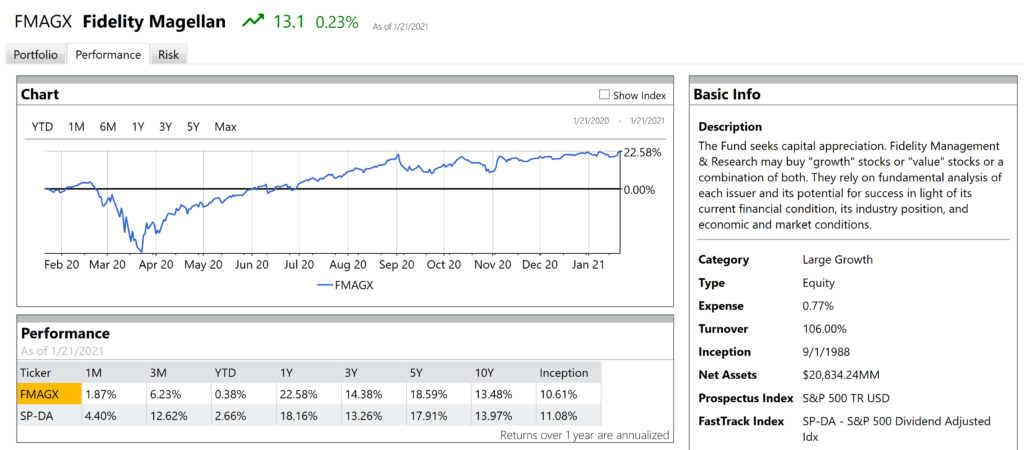
Performance Tab
The Performance tab displays a quick view chart of the security as well as Basic Info:
- Description
- Category
- Type
- Turnover
- Inception
- Net Assets
- Prospectus Index
- FastTrack Index
- Total Returns :1M, 3M, Year to Date, 1Y, 3Y, 5Y, and 10Y
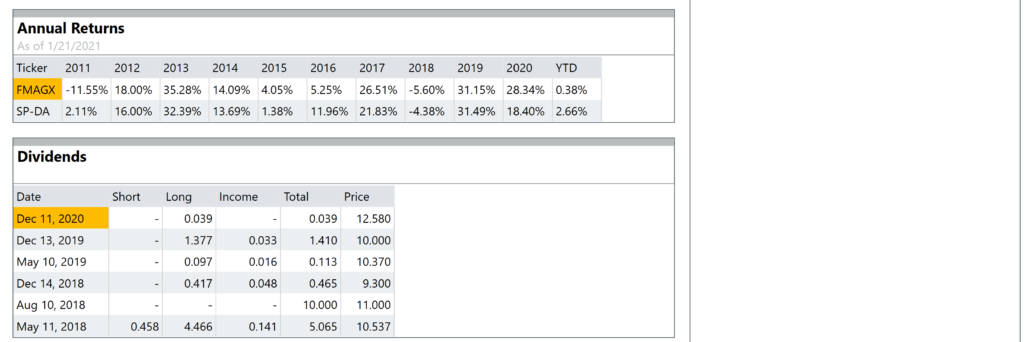
- Annual returns by year
- Last 3 years of dividends
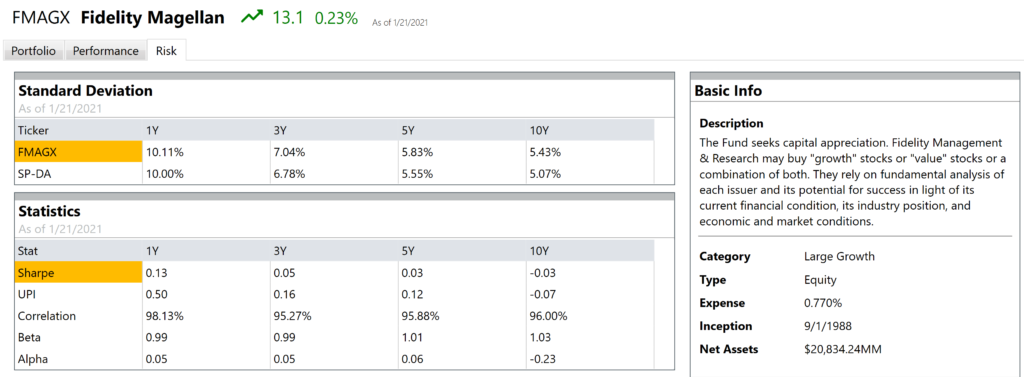
Risk Tab
The Risk tab shows highlights of a security’s risk profile
- Standard deviation vs its index for 1Y, 3Y, 5Y and 10Y
- Sharpe Ratio, Ulcer Performance Index, Correlation, Beta, and Alpha for 1Y, 3Y, 5Y and 10Y