• Skip to main content
  • Skip to footer

Investors FastTrack

Quality Data for Investing Strategies

  • Solutions
    • Advisors
    • Individuals
    • Businesses
  • Product
    • Tools
    • Data
    • FT4WEB
  • Plans
    • Subscriptions
    • Customer Service
  • Resources
    • Download
    • Investing Math
    • FT Comm Manual
    • FT Cloud Manual
    • Videos
    • Data Status
  • About Us
  • Current Subscribers
  • (866) 295-0166

FT Cloud

Apr 02 2022

Dual Momentum Investing

Dual Momentum Investing

Summary

In this post, we’ll reproduce Gary Antonacci’s dual momentum strategy using FT Cloud, Investors FastTrack’s data and portfolio modeling product.

Dual momentum is covered in detail in Antonacci’s 2014 book Dual Momentum Investing (http://a.co/bgR4Jx8). It’s a 10 chapter easy ready.

Sign up for a free trial of FT Cloud here and follow along. No credit card is required.

Start 14 Day Free Trial

Momentum Basics

There are two types of momentum investing- Relative Momentum and Absolute Momentum.

Relative Momentum

Relative Momentum is very popular with FastTrackers. Relative momentum is a binary comparison, between assets A and B. Traditionally you invest in asset A when its trend is strongest and asset B when its trend is strongest.

Relative Momentum Chart

Above is a classic example is small caps vs large caps. In the chart above, we see the results of owning Small Caps (IWM – iShares Russell 2000 ETF) when its trend is stronger than Large Caps (SPY – SPDR S&P 500 ETF), and vice versa.

Using In FT4web and FT Cloud, this is done with the R and J charts (https://investorsfasttrack.com/help/spreadsheet/ftchart/available-charts/). Or, a more advanced twist is the off the shelf FT Cloud momentum model (https://investorsfasttrack.com/basic-skills-videos/)

Absolute Momentum

Absolute Momentum compares the performance of an asset to a fixed target, not a relative target. In his book, Antonacci compares excess returns of an asset over cash during a 12 month period to calculate a positive or negative momentum.

Antonacci combines both Relative Momentum and Absolute Momentum (ie “dual” momentum). In FT Cloud+, the dual momentum concept is called the “hurdle rate.” Full documentation is here: https://investorsfasttrack.com/help/other/hurdle-rate/

Summary – Modeling Dual Momentum

dual momentum

In the chart above (3/18/05 – 3/18/19), the GREEN LINE is the results of the dual momentum model in FT Cloud (model detailed below). This line is the result of trading between:

  • IOTO – iShares Core S&P Total US Stk Mrkts ETF
  • EFA – iShares MSCI EAFE ETF
  • TLT – iShares 20+ Year Treasury Bond ETF

As the chart above depicts, employing a dual momentum strategy keeps the portfolio out of the 2008-2009 drawdown (by shifting to TLT when IOTO and EFA both perform lower than the hurdle rate TLT). Then again shifts to IOTO or EFA when regular conditions markets resume.

Backtest Dual Momentum in FT Cloud+

This is a complex model, but simple to execute in FT Cloud. Basically, we need to create an investment universe of the two iShares ETFs, IOTO and EFA. In FT Cloud this is called a “family.” (
https://investorsfasttrack.com/what-is-a-family/ )

Then, explained in plain English, the models works in two steps:

  • Step 1, every quarter rank the family over the trailing 12 months, then pick the fund with the highest total return.
  • Step 2, compare that fund to the total return of TLT (the hurdle) over the same period and invest 100% of proceeds in the ETF with the highest total return

The setup is about 4 button clicks in FT Cloud and outlined below in the step by step. Additionally, you can expand on this model buy adding more funds to the family and creating more complex hurdle rates (
https://investorsfasttrack.com/help/other/hurdle-rate/ ).

Also, in FT Cloud we produce logs for all the calculations, so you can audit all calculations.

Dual Momentum – Step by Step

1. Sign up for Trial

2. Build Dual Momentum Family

  • Navigate to the Data >> Family tab.
  • Click “New Family.”
  • Enter the “Dual Momentum” in the “Name” field.
  • Enter IOTO and EFA in the details grid.
  • Click “Save”

3. Build Dual Momentum Model

  • Navigate to FT Cloud+ >> Compare
  • Under the RED model, input:
    • # to buy = 1
    • % to sell = 100%
    • Family = “Dual Momentum”
    • Rank By = Return
    • Tr Delay = 1
    • Rnk Period = Quarter
    • Rebalance = Annual
    • Model = Momentum
  • . For this dual momentum option, % to sell MUST be 100% and the # to buy MUST be 1. All other parameters can be customized.

4. Add Hurdle Rate (FT Cloud’s Dual Momentum)

  • Still on FT Cloud+ >> Compare, click “hurdle rate” on the right middle of the screen to display the Hurdle Values parameter input
  • Check the checkbox next to the red rectangle to activate the red model’s hurdle rate.
  • Add “TLT” in the “Hurdle” input
  • Check the checkbox next to “replace”
  • Click “apply.”

5. Run Model

Press run at the upper right of the FT Cloud+ >> Compare screen.

  • The bottom half of the FT Cloud+ >> Compare screen will display a chart.
  • The grey line is the benchmark (set with the benchmark input on the upper right).
  • The red line is the dual momentum model.
  • Statistics for the time period are displayed in the right of center area titled “Statistics”

You may also like:

https://investorsfasttrack.com/backtest-bogles-3-position-portfolio/
https://investorsfasttrack.com/products/

Written by FT Cloud · Categorized: Strategy · Tagged: dual momentum

Jan 04 2022

Creating Leveraged Investment Portfolios

Leveraging Investment Portfolios

Summary

In this post, we’ll model a 1x leveraged investment portfolio of JNK – SPDR Blmbg Barclays High Yield Bond ETF. Next, we’ll model using a 50 / 200 moving average of JNK to add and remove the leverage.

Said in simple terms, we’ll leverage the portfolio when the 50 day is over the 200 day average. When the 50 day drops below the 200, we’ll de-lever and just hold JNK.

All modeling is done with FT Cloud and FTCloud’s static model. Watch a quick overview of the Static Model here. Sign up for a free trial here:

Start your 14 day Free Trial

What is Leverage

Leveraging a portfolio is when an investor borrows money to purchase securities. If the securities purchased with borrowed money appreciate, you enhance your profits without using your own capital. If the purchased securities produce a loss, you repay the debt at par and magnify the loss on investment.

Fire In Your Living Room

Leverage can greatly magnify gains and losses. Certain investors live and die by leverage, but it’s not something to employ lightly. I recently had a user describe it to me like this: “It’s like building a fire in the middle of your living room. While that fire will heat your house and keep you warm, if you don’t keep on top of it will burn the place down.”

Modeling Leverage

We’ll jump right into FT Cloud. We’ll use the Static Model to accomplish our goals.

Leverage Mutual Fund and ETF portfolios

First, navigate to the (1) Data >> Static Model tab. Then look in the (2) lower middle of the screen for the leverage details. The leverage info gives you the % leverage, margin rate, and % cash in the portfolio.

Leverage Mutual Fund and ETF portfolios

To create a leveraged model, allocate weighting to the portfolio that adds to more than 100%. The above picture shows an example portfolio with a 250% allocation.

Relating this to a $100,000 portfolio, the above example would have the following positions:

SPY – $150,000
TLT – $100,000
Total – $250,000

Margin Rate

The margin rate is the cost of borrowing funds. This is expressed in an annual percentage rate. The interest compounds each time the portfolio rebalanced. A monthly rebalance has monthly compounding interest and a weekly model has weekly compounding interest.

Set the global margin rate on the Login>>Advanced Options screen.

Leverage is the total leverage on the portfolio. In the above 250% leverage example, $100,000 is the original capital position, and the $150,000 is the leveraged position. $150,000 / $250,000 = 150% leverage.

The cash position is the balance in cash for any models that have under 100% allocations. A model with a single SPY position of 80% will show a cash position of 20%.

Calculate the Portfolio

Once we have our details dialed in, we need to crunch the portfolio. In FT Cloud, we’ll create an FNU by clicking the “Create FNU” button.

This saves an FNU file to your local disk and adds a new ticker to your FT Cloud database. The value in the “ticker” field is used as the portfolio’s new ticker. Use this ticker anywhere in FT Cloud.

Checking the Work

Open Log will open the windows folder where all leveraged model logs are stored. The leverage log is a .CSV file that has the following columns:

  • Date – Market date of values
  • Non Levered Portfolio – value of the underlying non-levered static model. In the above 250% example, this would be the values of a 60% SPY, 40% TLT portfolio. To calculate the model FT Cloud creates a non levered static model with the following weightings: $150k / $250k = 60% SPY and $100k / $250k = 40% TLT portfolio. Once this 60/40 portfolio is calculated, then FT Cloud applies 150% leverage to the 60/40 portfolio.
  • Running Total Non Levered Portfolio – The daily value of the un-levered portion of the portfolio. This is a “show your work” value. It acts oddly by jumping in value at the beginning of every month. This is due to the resetting of the un-levered value to the previous day’s [Levered Portfolio Value] (plus the day’s price change)
  • Original Borrowed Amount – the amount borrowed at the beginning of the investment period. This value resets every time the portfolio is rebalanced. This value change does not change throughout the period. ie. you borrow a fixed dollar amount on the first day of the month, then repay that same fixed dollar amount at the end of the period.
  • Borrowed Amount Value – the daily value of the borrowed funds. On the first day, the original borrowed amount is invested with the same allocations as the nonlevered portfolio. Each day the [Borrowed Amount Value] changes according to the change of the [Non Levered Portfolio]
  • Period Cost – the fractional portion of the annual interest charged over the investment period. This also remains unchanged during the period. Since we borrow a fixed value on day 1, the interest is charged off that fixed value. This is calculated as:
    ( [margin rate] / [rebalance frequency] ) * [Original Borrowed Amount]
  • Daily Cost – the period cost divided by the number of market days in the investment period. For the same reasons, this value does not change during the investment period.
  • Net Return on Borrowed Amount – This is the result of the following equation:
    [Borrowed Amount Value] – [Original Borrowed Amount] – [Daily Cost]
  • Levered Portfolio Value – This is the result of the following equation:
    ( [Previous Day Running Total Non Levered Portfolio] * [Daily return of Non Levered Portfolio] ) + [ Net Return on Borrowed Amount]

Click the link below for a google sheet log of the above leverage model. Columns A-I shows the regular log values. Columns K-Q show the work of how the values are derived.

https://docs.google.com/spreadsheets/d/1WSRegP95Hz_BbEaSQj1-psvlRfmmH0nxusy5zA1IeOE/edit?usp=sharing

Written by FT Cloud · Categorized: Strategy · Tagged: investing, knowledge base, leverage, simple strategy, smarts

Jan 04 2022

Fund, ETF, Stock, and Index Requests

Targeting next day turn around

If we’re missing a security that’s important to you, don’t be shy and request to data@fasttrack.net.

Send us any fund, ETF, stock or index and we will add it.

Database Basics

For mutual funds, we target including Investor and Institutional classes of all US funds available for sale.

As a default, we include all ETFs and listed US stocks that have a 90-day volume over a certain threshold. As of 7/25/19, that’s 2,250+ ETFs and 5,000+ stocks and ADRs.

Customer is Always Right

All that being said, if it’s important to you we’ll add it.

A long-time FastTracker sent us a list of his broker’s NTF symbols not in FastTrack. The list was an assortment of non-Investors and non-Institutional share classes totaling over 700 symbols. We turned those around the next day!

Don’t be shy. We target getting requests in by the next day, with many requests added the same day. Fire away!


Written by FT Cloud · Categorized: Data News

Jan 04 2022

Simple Steps for a Diversified Portfolio

path to a diversified portfolio
A diversified portfolio will reduce your portfolio volatility and allow you to sleep better at night. But, what does it actually mean to have a “diversified portfolio?”

Simple Actions for a Diversified Portfolio

Put half your money in an S&P 500 Fund (VFINX – Vanguard 500 Index in yellow) and half in US Treasuries (VUSTX – Vanguard Long Term Treasuries in green).

The red line is a 50%-50% blend, rebalanced monthly. The result is a nearly straight line up with very little volatility. In fact, you’ve heard that you should put some money in bonds and some in stocks. But you never understood why. This is called good risk-adjusted return and is the result of a quality diversified portfolio.

diversified portfolio - stocks and bonds

In the most recent market downturn since 9/20/2018, your red portfolio lost 4.81% while the yellow broad market lost 8.19%. Simple . . . but there is more.

A simple analysis to shift assets between bond and funds over the last 30 years turned $100K into $2,765,000 million with lower risk than owning just equities.

FastTrack’s database includes history back to 1988, so we can analyse these, and any other, strategy through multiple business cycles, bull and bear markets, interest rate hikes and cuts, and much more.

30 year history of a diversified portfolio

Only Scratching the Diversified Portfolio Surface

In this example we used two very big, very broad, very popular Vanguard indexes. Adding Emerging Markets, Commodities, Sectors, etc will further enhance portfolio diversity and boost returns. FastTrack’s software can easily model a new, extended portfolio of more funds, ETFs or stocks.

Next Steps

Sign up for a free trial of FastTrack’s software and data: https://investorsfasttrack.com/products/ There is no cost for 30-days. We won’t ask for your credit card.

Our software includes millions of correct daily data points and simple portfolio building tools.
You get all the free support and training one-on-one. Call 866-295-0166 x 1 open 9AM to 5PM Eastern.

Read more about Reduce Portfolio Volatility or visit our blog: https://investorsfasttrack.com/blog/

Written by FT Cloud · Categorized: Market Commentary, Strategy

Jan 04 2022

Backtest Bogle’s 3 Position Portfolio

The Bogle’s 3 position portfolio, popularized by John Bogle, takes a “simpler is better” approach to portfolio construction.

Basically, the approach calls for only owning three positions via low cost index funds/etfs: total us stock market, total bond market, total international market.

The link above will give all the background on “why,” in this post we’ll just be reviewing how to backtest and analyze the strategy so YOU can make a more informed decision if its right for you.

Step 1:

No credit card is necessary, just a valid email address.

Step 2: The Three Funds

To select the three vanguard funds to use in our analysis, we used the FT Cloud family Sieve (https://investorsfasttrack.com/help/spreadsheet/sieve/) to filter Vanguard funds by size and strategy.

We landed on:

  • US Stocks – VTSMX – Vanguard Total Stock Markets Index
  • Bonds – VBTLX – Vanguard Total Bond Market Index
  • International – VGTSX – Vanguard Total Intern’l Stock Index

Step 3: Build the Portfolio

Next, we’re going to build our three fund portfolio and view it on a chart. To start, we need to create an FT Cloud Static Model (https://investorsfasttrack.com/help/other/static-model/) This is a simple set of instructions FT Cloud will use to chart our three fund portfolio.

For this example, we’ll weight 60/30/10 across the above tickers.

  • VTSMX – US Stocks – 60%
  • VBTLX – Bonds – 30%
  • VGTSX – International – 10%

Open FT Cloud and log in, then:

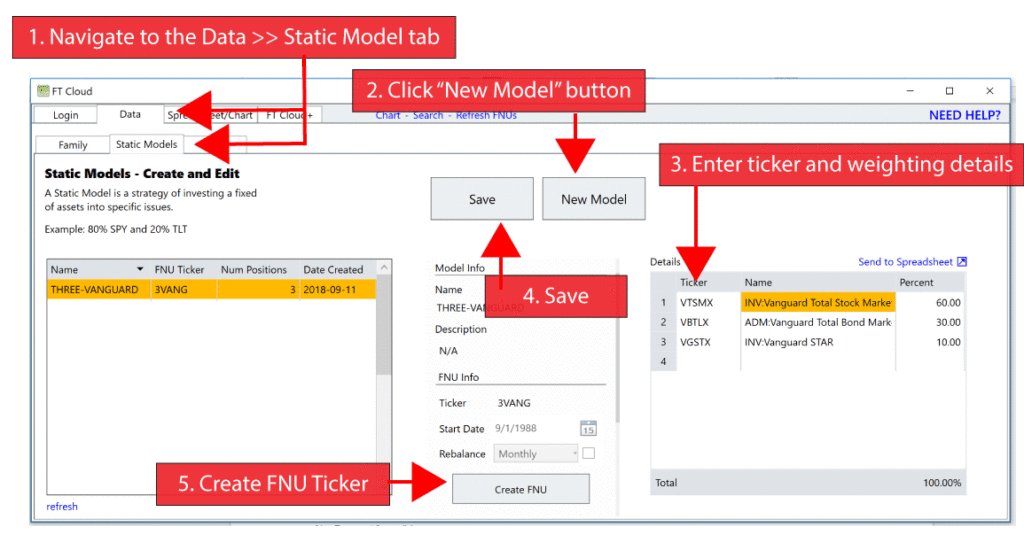
  1. Navigate to the Data >> Static Model tab
  2. Click “New Model” button
  3. Enter above tickers and weightings into “Details” grid on the right
  4. Press “Save” in top center
  5. Click “Create FNU” button in center column

The actions above will create a new ticker in the database. This ticker is the result of owning the tickers above, at the above weightings, rebalanced once a month (update the “Rebalance” drop down on the static model tab to change the rebalance setting.)

Step 4 – Chart Results

Now comes the fun part. Our new ticker is 3VANG (Click “edit” on the static model tab to edit this ticker if you’d like.).

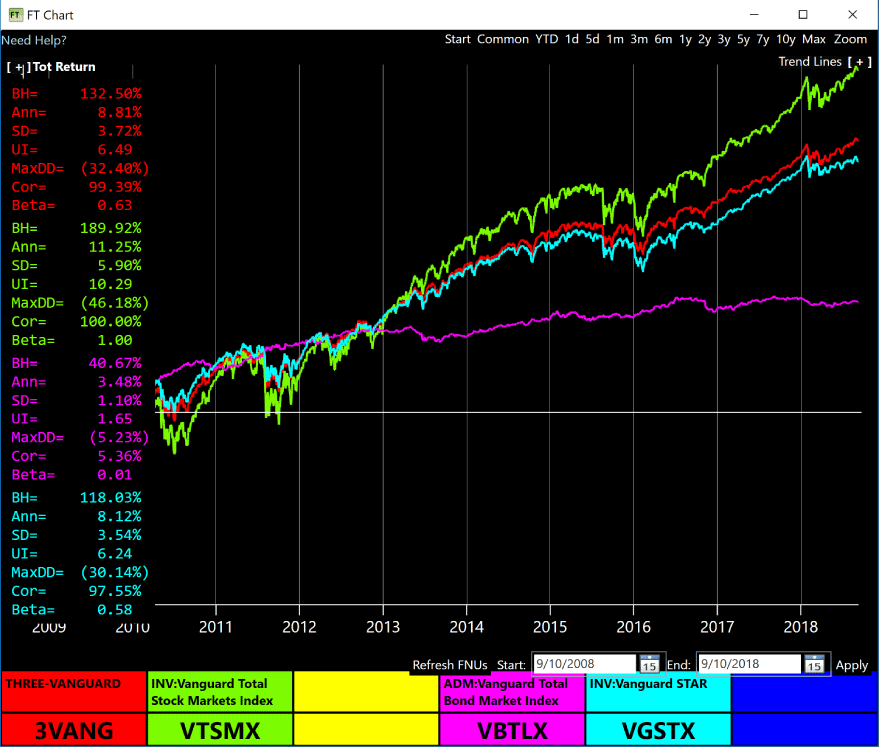
You can now type this ticker anywhere in the FT Cloud product and view/compare the portfolio results. Below is a chart of 3VANG and the components. Click “Chart” in blue at the top of FT Cloud. This is launch a new window that displays the FT Chart.

Analysis

To keep this simple, lets look at return, risk, and correlation. The chart above shows a 10 year time period, 9/10/2008 – 9/10/2018. Important stats for the time period are displayed in the upper left of the chart.

Return – In red we see the three fund portfolio displays an annualized return of 8.46%, compared to the 11.25% of our total market index (VTSMX) in green. So, our red three fund portfolio has 77% of the return of the total market.

Risk – Measuring risk by standard deviation, our three fund portfolio (red) shows 3.95% of the time period vs 5.9% for our total market index (VTSMX) in green. So, our three fund portfolio has approx 66% of the risk of the total market fund.

Correlation – in the FT Chart, correlation is always against the green ticker. So, in the picture above, our red three fund portfolio has a 99.25% correlation to the green total stock market.

Summary

In a few clicks, we easily built a popular and simple investment model. We looked at those result in a chart and compared its risk and performance to the total market.

The stats speak 1000 words. Does this portfolio make sense for your objectives? Does that reduction in risk justify the reduced returns?

It was surprising to see the 99% correlation to VTSMX. The portfolio is 40% bonds and international, yet still correlates highly to the total US market.

Next Steps – Improve

Is it possible to improve the risk return profile by adding 1, 2, 3, 4+ more funds? Is there a fund that can drop the market correlation without hammering returns?

FT Cloud has a whole host of stats, metrics, etc to analyze portfolios. You can pull data up in a spreadsheet, chart, or export it to your software/analysis package of your choice to answer those questions.

Sign up for a trial to get started

Written by FT Cloud · Categorized: Strategy

  • Go to page 1
  • Go to page 2
  • Go to page 3
  • Interim pages omitted …
  • Go to page 11
  • Go to Next Page »

Footer

Contact Us

Investors FastTrack
(866) 295-0166

Investors FastTrack © 2025