• Skip to main content
  • Skip to footer

Investors FastTrack

Quality Data for Investing Strategies

  • Solutions
    • Advisors
    • Individuals
    • Businesses
  • Product
    • Tools
    • Data
    • FT4WEB
  • Plans
    • Subscriptions
    • Customer Service
  • Resources
    • Download
    • Investing Math
    • FT Comm Manual
    • FT Cloud Manual
    • Videos
    • Data Status
  • About Us
  • Current Subscribers
  • (866) 295-0166

FT Cloud

Mar 05 2018

Is Passive Investing Actually Active?

Interesting article on the development of passive investment products. “There are now so many indexes that putting your money in an index-tracking fund is a move requiring an active decision…” So, even largely passive strategies require some judgement or active management.

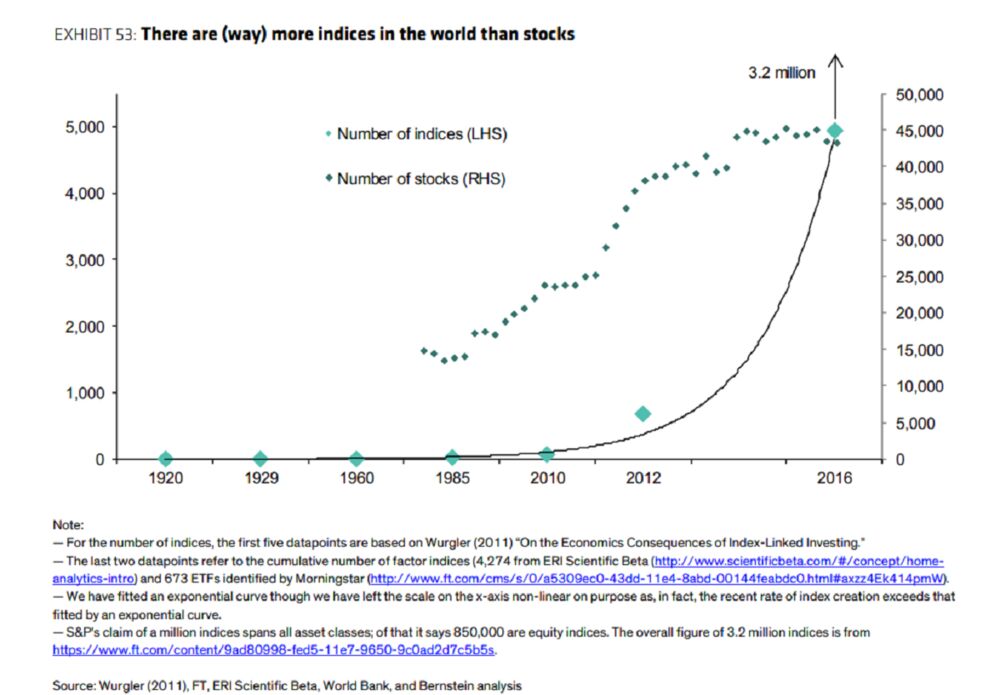
There’s over 3 million indexes and only 3,000 investable stocks in the US. So, as the article says, allocating to passive strategies require some discretionary decision making.

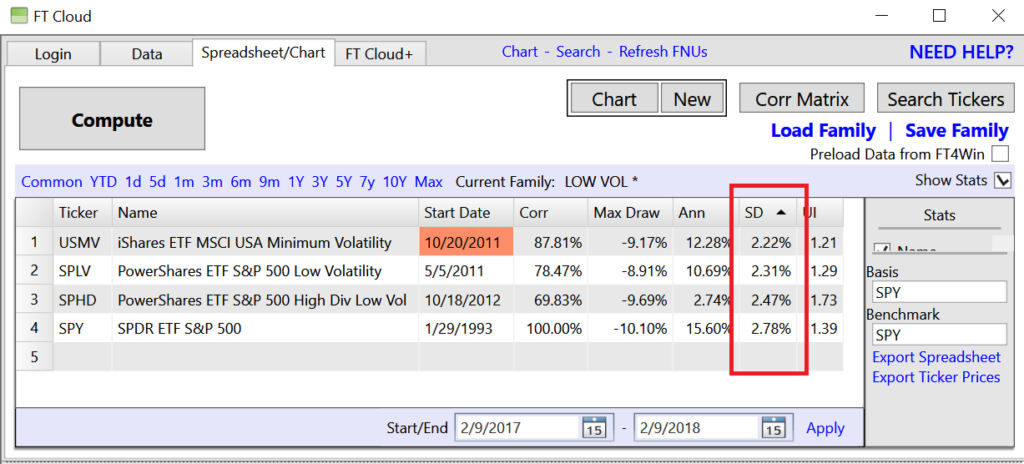
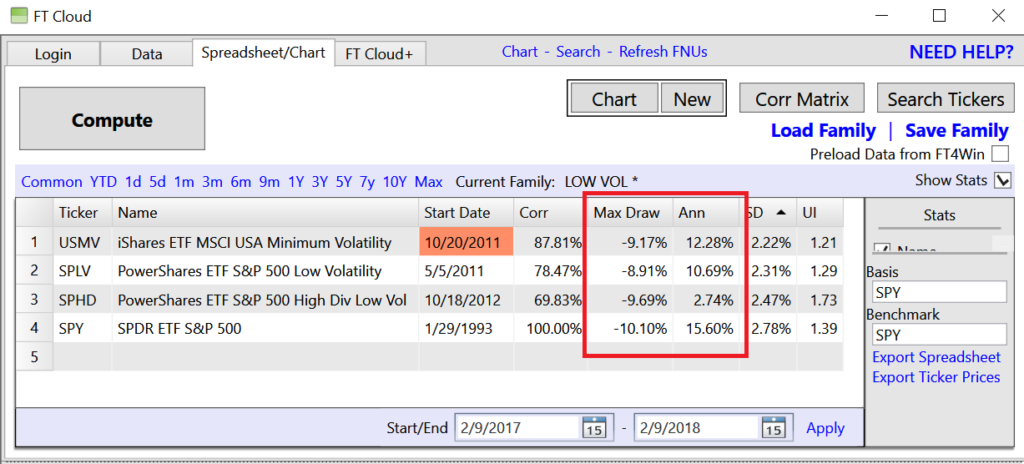
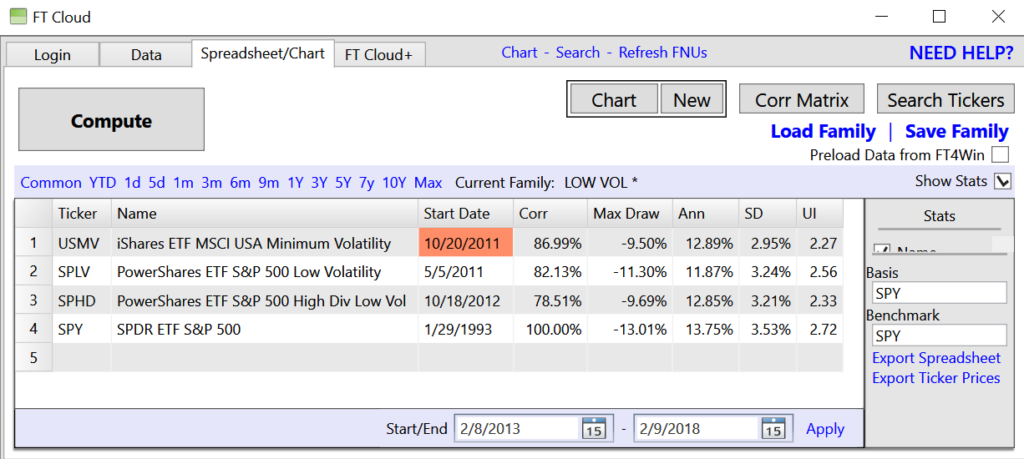
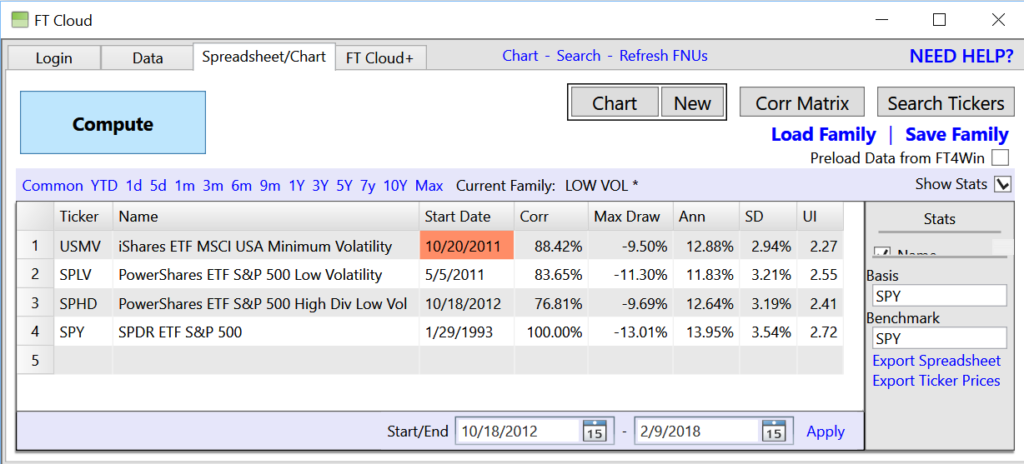
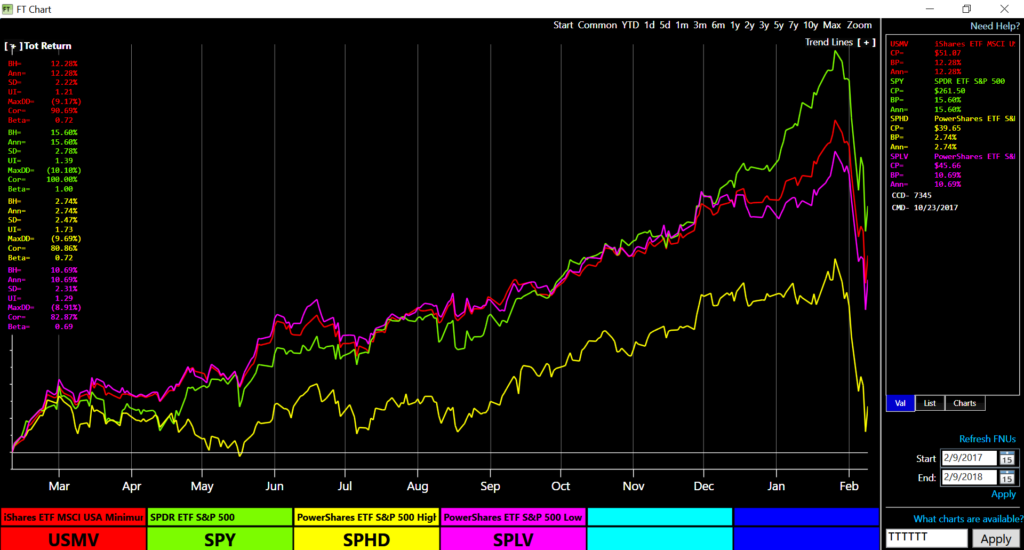
For 25 years FastTrackers have used the spreadsheet tool to rank, sort, and analyze both passive and active funds and ETFs. If you’re not using a tool like FastTrack you’re going to have a hard time sorting through the options. Correlation, standard deviations, and ulcer index, Sharpe and UPI are key metrics FastTracker’s use to cut through the noise and build portfolios.

With a six figure portfolio, the subscription should pay for itself within the first month.

Check in later this week for an analysis on how to analyze/review the free iShares portfolios distributed by BlackRock.

https://assets.bwbx.io/images/users/iqjWHBFdfxIU/i0cKaGzN2gx0/v0/1000x-1.png

Written by FT Cloud · Categorized: Market Commentary, Strategy

Feb 27 2018

Data Quality – Screening Funds and ETFs

Here’s a great illustration of why you need dividend adjustments when analyzing funds and ETFs. QLENX (a lower risk AQR managed long short fund) has been popular with FastTrackers for a few years and it would be totally off your radar if you’re using Yahoo, CNBC, Fidelity, or any number of other free data outfits for charting and ranking.

Only FastTrack is adjusting for the 12/19/2017 dividends. Adjusting for dividends, a simple UPI ranking puts QLENX on top for the past three years. Without adjustments, QLENX’s risk/ return profile is misrepresented and pushed to #644 in the rank.

The black FastTrack chart illustrates the difference pretty clearly. The large dip towards the end of 2017 is the div payout of QLENX. The NAV drops, share price is reduced, but without accounting for the div payout you’ll get incorrect charting and ranking.

This is what FastTrack is known for. We’ve been providing this high quality, dividend adjusted data to professionals and individuals for over 27 years. Download a trial or give us a call.

QLENX in Red; SPY in green; Yahoo’s QLENX data in yellow; Three year chart; Feb 2015- Feb 2018
FastTrack’s dividend adjusted data shows the proper ranking.
Totally bogus ranking when data is not corrected for dividend payouts

 
No Divs – Incorrect chart from Finace.Yahoo.com

No Divs – Incorrect chart from CNBC.com

 
No Divs – Incorrect chart from Fidelity.com

Written by FT Cloud · Categorized: Data News, Strategy · Tagged: dividend adjustment, dividends, investing, knowledge base, support

Feb 22 2018

How to invest in Artificial Intelligence

artificial intelligence

There’s lots of buzz surrounding AI (artificial intelligence). It’s changing the world as we know it and also is showing strong out performance over the past year. Here’s a list of AI related names in the FastTrack database.

The charts below shows the relative strength chart vs SPY of the two most popular ETFs, BOTZ and HACK. BOTZ is showing nice strength vs SPY while HACK is mixed to losing steam. Do AI names have more room to run or have they given us all they’ve got?  Love to hear your comments.

BOTZ - Global Robotics & Artificial Intelligence ETF
BOTZ vs SPY – 1 year Relative Strength (Feb 2017 to Feb 2018)
HACK - Pure ETF ISE Cyber Security
HACK vs SPY – 1 year Relative Strength (Feb 2017 to Feb 2018)

Artificial Intelligence
AIEQ – AI Powered Equity ETF
ARKQ – ARK Industrial Innovation ETF
BOTZ – Global Robotics & Artfcl Int’llgnc ETF
HACK – Pure ETF ISE Cyber Security
ROBO – ExTrd Concepts Robo Glbl Robotics&Autmtn
SOCL – Global X Mgnt ETF Social Media
TCHF – iShares ETF Edge MSCI Multifactor Techn
XT – iShares ETF Exponential Technologies
DTEC – ALPS Disruptive Technologies ETF *
ROBT – First Trust Nasdaq Artificial Intelligence and Robotics ETF *
BUZ – BUZZ US Sentiment Leaders ETF *

* Well be added to FastTrack database by end of February 2018

Written by FT Cloud · Categorized: Data News, Strategy · Tagged: ai, relative strength

Feb 20 2018

Charting Bitcoin with FastTrack

Bitcoin graphic fasttrack

Bitcoin is back on the front page, breaking above above the $10k mark again last week. While its a speculative asset class and typically not something a FastTracker would devote much capital, we have been getting a good number of calls about Bitcoin, Blockchain, and related tech.

What do we think, worth a gamble?

He’re a quick list below of most popular/ asked about ETFs, Funds, and stocks. Look out for the bitcoin family coming soon.

Bitcoin/ Cryptocurrency/ Blockchain
GBTC – Bitcoin Investment Trust
ARKW – ARK Web x.0 ETF
ARKK – ARK Innovation ETF
BLOK – Amplify Transformational Data S ETF
BLCN – Reality Shares ETF Nasdaq NextGen E
KOIN – Innovation Shares NextGen Protocol ETF
LEGR – First Trust Indxx Invtv Tnsctn&Prcs ETF
KOIN – Innovation Shares NextGen Protocol ETF

Stocks
LBCC – Long Blockchain Corp
OSTK – Overstock
RIOT – Riot Blockchain
KODK – Eastman Kodak Co
MGI – MoneyGram International
NVDA – Nvidia

Written by FT Cloud · Categorized: Data News, Market Commentary · Tagged: bitcoin, blockchain, etf, investing, new tickers

Feb 12 2018

How are low volatility ETFs holding up?

How are low volatility ETFs holding up?

Over the past 5+ years, a variety of low volatility equity ETFs have launched with rapid growth. In light of the recent market volatility, how are the funds holding up? The top three are listed below and have a combined AUM of $24 billion:

  • SPHD – PowerShares ETF S&P 500 High Div Low Vol
  • SPLV – PowerShares ETF S&P 500 Low Volatility
  • USVM – iShares ETF MSCI USA Minimum Volatility

The FT Cloud SpreadSheet below highlights that the dividend adjusted stand deviations are in fact lower than SPY. So, the funds are producing the described lower volatility.

But what do we think about recent max drawdown numbers and the trailing 12 month returns? The picture below highlights the trailing 12 months total returns and recent draw down. While the ETFs are producing only 80-90% of SPY’s monthly volatility, they’re producing 90%+ of the drawdowns and a mere 20-80% of the returns.

Over the longer term (3 year, 5 year, and common start date), the ETFs are showing consistent lower SD while maintaining comparable annualized returns. See the three year, 5 year, and common start date views below.

Are these worth holding in your portfolio? We’ve love to hear your thoughts.

Three Years (Feb 2015- Feb 2018)
Five Years Feb (2013- Feb 2018)
Common Start (Oct 2012- Feb 2018)
One Year Total Return (Feb 2017 – Feb 2018)

Written by FT Cloud · Categorized: Market Commentary, Strategy · Tagged: commentary, etf, investing, low vol

  • « Go to Previous Page
  • Go to page 1
  • Interim pages omitted …
  • Go to page 4
  • Go to page 5
  • Go to page 6
  • Go to page 7
  • Go to page 8
  • Interim pages omitted …
  • Go to page 11
  • Go to Next Page »

Footer

Contact Us

Investors FastTrack
(866) 295-0166

Investors FastTrack © 2025