• Skip to main content
  • Skip to footer

Investors FastTrack

Quality Data for Investing Strategies

  • Solutions
    • Advisors
    • Individuals
    • Businesses
  • Product
    • Tools
    • Data
    • FT4WEB
  • Plans
    • Subscriptions
    • Customer Service
  • Resources
    • Download
    • Investing Math
    • FT Comm Manual
    • FT Cloud Manual
    • Videos
    • Data Status
  • About Us
  • Current Subscribers
  • (866) 295-0166

FT Cloud

Feb 06 2018

Even with Poor Timing, Stocks Still Produce Wealth

Great quotes on investing for the long term. Even if your timing is the worst, over the long term equities have been “the best generator of wealth.” See the FT Cloud Spreadsheet shots confirming the quote.

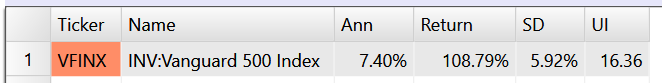
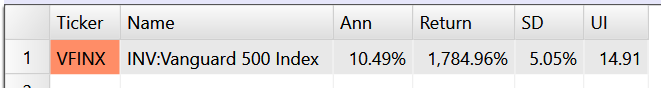
 “If you look back historically, at the top in 1987 since then the annualized returns in the S&P 500 have been 9.6 percent. If you go back to March of 2000, if you bought at the top, the annualized return since then is 5.7 percent. And if you bought at the top in October 2007, annualized returns are 7.5 percent,” he said.

The three tops he was referring to were right before the 1987 crash, the top of dot-com bubble before it burst in early 2000, and the high before the 2008 financial crisis.

“At the worst times to buy in the last 30 years, the stock market has been the best generator of wealth than any asset class,” he said. So imagine the gains if investors were to have bought on the way down after those events, he added.

https://www.cnbc.com/2018/02/06/bespoke-paul-hickey-buy-dips-because-buying-at-past-tops-still-paid.html

August 1, 1988 to Feb 2, 2018

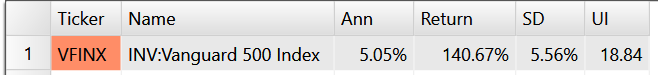
March 23, 2000 – Feb 2, 2018

October 9, 2007-Feb 2, 2018


Written by FT Cloud · Categorized: Uncategorized

Dec 09 2015

Energy MLPs – What’s the deal?

MLP-listMaster limited partnerships (MLPs) have been all over the news lately. Oil and natural gas are down significantly this year, and in return, MLPs have been clobbered. (The popular AMLP – Alerian MLP is down over 35% year to date.)

MLPs operate a toll road business model and produce large, dependable dividends. With interest rate so low, for so long, MLPs have had increased popularity with FastTrackers over the past 5+ years.

This post will not get into whether we’re at a bottom or if they’ve got another leg down on tap. I’ll leave that to the talking heads on CNBC. In this post we’ll look at how to use the family sieve to build a family that contains all the many different MLP asset in the FastTrack database. Since MLP investments can exist as funds, etfs, and stocks, we’ll have to combine multiple families to get the complete list of all MLP assets in the FastTrack database.

What questions will we answer?

Once we build the MLP family, we’ll have a good list of tickers to do a relative analysis to answer questions like:

  • Which MLPs drew down the most?
  • Did all MLPs draw down?
  • Did MLPs mutual funds do better than ETFs?
  • Are stock based MLPs riskier?
  • Etc

Master Limited Partnership Basics

But first, let’s get some MLP basics. MLPs are the publicly traded partnerships that own, operate, and build energy infrastructure assets such as pipelines, storage facilities, and processing plants. The assets MLPs own are like a national highway where cars pay a “toll” to travel from state to state. Instead of cars, MLPs transport hydrocarbons and charge a “toll” to transport them from upstream producers and the end user.

MLPs charge based on the volume of product they move, so the “tolls” they charge tends not to fluctuate with the price of commodities. In order to grow, MLPs essentially have to acquire infrastructure or build it. In the recent low interest rate and easy credit enviornment, debt has been the preferred method to finance MLP growth. MLPs add debt to expand and keep paying out earning as dividends. With rates on the rise (in particular junk yields), this business model has come under stress and caused heavy draw downs across the industry.

How to build the MLP Family.

Familiy-Tree-and-SieveOpen the First, open spreadsheet “Load Family” screen. The Load Family window displays a treeview of all the FT Cloud families on the left side and a sieve to collect and funnel those families on the left.Familiy-Tree-and-Sieve-Search Next, Since we don’t know where in the tree MLPs exist, we’ll search the family tree for all families that the name contain the word “partnership.”

    1. enter “partnership” in search text box
    2. select the “family” search option (this will search all family names)
    3. press search button to display results

The search results show a family under the Funds & ETFs >> Objective >> Commodities >> Limited Partnerships. Double click the name to load the tickers into the right side list.

The limited partnership family gives us all the MLP funds and ETFs. Now we want to include all of the stock based MLPs. To do this, we’ll use an alternate search method. 
Familiy-Tree-and-Sieve-Search2We’ll search all families that contain a well known MLP stocks, Kinder Morgan (KMI). If a stock MLP family exists, it definitely contains this well known company. As the search results show, there are a handful of families that contain KMI, but the one we want is the Stocks >> Industry >> Oil & Gas Midstream.

Now, we’ll SINGLE CLICK the family to highlight it. Then we will click the “add” button in the upper center/right to add the Oil & Gas Midstream tickers to the ticker list in the lower right (previously loaded from the “Limited partnership” family.

We can repeat these steps any number of times with other keywords or tickers to make sure we have all MLP tickers. For now, we’ve got 149 MLP ticker in the combined family list, so click the “load” button in the lower right to load the 149 tickers onto the spreadsheet.

Now that we have all the MLP tickers on the spreadsheet. We can rank, sort, chart, and do other relative analysis work to determine industry trends, best of class funds, out performance, etc.

Written by FT Cloud · Categorized: Family, Market Commentary, Strategy

Oct 09 2015

Correlation Study – Investing in Fear

Investing in fearWe had a great tech support call come in today. A long time FastTracker has been “tracking the VIX” and looking to get direct exposure to the index. He asked, “what’s the ticker to buy the VIX?”

Well, the answer is simple, but first let’s go through some background. The VIX is an index, more specifically its the CBOE Volatility Index (FastTrack ticker VIX-X). The vix usually referred to as the “fear index” and typically tracks opposite to the overall market. An investor would look for exposure to the VIX to capitalize on market downtrends.

That being said, the VIX is still an index. So… you cannot buy it directly. You must buy an ETF or mutual fund that tracks the VIX index. So, how do you use FT Cloud or FT4web to find these ETFs? Its simple, we’ll do a correlation analysis with the spreadsheet. We’re going to look for all and any fund in the FastTrack database that is highly correlated to the CBOE VIX index.

Note: We could search ticker names, google search, or something similar. But if you’ve used FastTrack techniques and products, you’re well aware that names are some of the least informative aspects of a security. Just because you call yourself a “VIX ETF,” doesn’t mean you are a VIX ETF. The score board (past performance) says it all. 

Here’s a step by step to find the ETF that track the VIX.

  1. First we’re going to load all the ETFs in the FastTrack database. Log in to FT Cloud, click on the FT Cloud spreadsheet tab, in the upper right corner, click the “load family” button. Investing in the VIX
  2. Next, navigate to the All ETF family. Its located under the Funds > Companies > ETFs > All ETFs. Double click the family, then click load in the lower right of the load window.Investing in the VIX
  3. Now, to run our correlation study, we’re going to find all the ETFs that have a high correlation to the CBOE VIX Index. In FastTrack the CBOE VIX index uses the ticker VIX-X (We used the ticker search feature to find the index). The correlation column on the spreadsheet correlates to the “benchmark” field. So, we’re going to type VIX-X into the benchmark field and change our dates to a one year time period (this example uses a one year correlation study… but you can alter the date ranges for different studies)Investing in the VIX
  4. After we press the “Compute” button in the upper left corner, the spreadsheet will fill with the calculations we need for the study. Next, we are going to click the “Corr” header to sort the spread sheet from highest correlation to lowest correlation. (Click the Correlation check box in the “stats” list on the right hand side to show the correlation column on the spreadsheet.)Investing in the VIX
  5. There we have it. While there’s no perfect 100% correlation, we get pretty close with 91%-88% range over one year.

So, to summarize, to find an ETF, or in this case ETFs and ETNs, that track the CBOE VIX index, we do a simple correlation study. This study shows us that we don’t have an instrument that tracks the CBOE VIX index exactly, but we’ve got a handful of ETFs and ETNs that get pretty darn close.

Results: The we derived the following one year correlations to FT ticker VIX-X

  • VIXY – ProShares VIX Short-Term Futures- 91%
  • VIIX- VelocityShares VIX ST ETN – 90.89%
  • UVXY – ProShares Ultra VIX Short-Term Futures – 90.59%
  • TVIX – VelocityShares Daily 2x VIX ST ETN – 89.53%

Written by FT Cloud · Categorized: Market Commentary, Strategy · Tagged: CBOE, correlation, etf, ft4web, spreadsheet, VIX

Oct 06 2015

New Families – Smart Beta

smart beta cube

Its hard to open a newspaper (or news app) these days and not see something about “smart beta,” “liquid alternative,” “strategic beta,” etc etc. There’s hot… Red hot right now. As such, we’ve created a FT Cloud family grouping for these funds. (see the instructions below to find the new family)

So, what is a smart beta ETF? Generally, its an ETF that weights its holdings by something other than market capitalization. They’re generally marketed as a hybrid between passive investing and active investing.

For example, RSP – Guggenheim S&P 500 Equal Weight ETF hold all companies in the S&P 500, but instead of market weighting the assets, RSP hold equal weights of all 500 assets.

Another good example is MTUM – iShares MSCI USA Momentum Factor ETF. It operates largely like the FT Cloud momentum model. The ETF holds approx 100-150 large and/or midcap stocks that have shown the highest 6 and 12 month total returns, then it market capitalization weights those funds for its final holdings. Its rebalances the holdings approximately once a quarter.

The smart beta segment is already big and its growing. According to FactSet there’s approx 450 strategic/smart beta ETFs currently in the market and there’s approx $450 billion invested. That’s up from 213 funds managing $132.5 billion in assets in 2009. FastTrack’s got 480 ETF (and some funds) that qualify as “smart beta” per our analysis. So, enjoy. Let us know what you think.

How to see the Smart Beta Family in FT Cloud:

First, sign into FT Cloud (sign up for a free trial here), click the FT Cloud tab, then press the “Load Family” button in the upper right corner.

smart beta load family

Next, expand the top tree level “Funds,” navigate to the bottom tree called “Smart Beta” and expand. Double click the families to load on the the right hand grid (press the load button to add to the spreadsheet)

smartbeta family selection

Also, to mix and match families, try using the sieve feature!


Written by FT Cloud · Categorized: Data News, Strategy · Tagged: etf, liquid alt, momentum, relative strength, smart beta, strategic beta

Sep 30 2015

Sieve Practical Example

layer

In this post, I’ll walk through a typical use case of a fund sieve.

Investors Question: “I have a Fidelity retirement account. Where do I start?”

For this really simple example, we’re going to load all the funds in the Fidelity family. Then remove all funds that are not in the Giant family. Then we’ll remove all funds that have a front end load.


  1. First, sign in to FT Cloud, open the spreadsheet tab (labeled “FT Cloud”), and click the “Load Family button in the upper right.FT Cloud Sieve
  2. Next, we’re going to load the Fidelity family (Funds>>Company>>All>>Manage Large Number of Funds >> Fidelity)FT Cloud Sieve
  3. This next step is the important part. The Fidelity family has 913 funds. We want to pare this down to a more manageable, actually invest-able list. To start, we’re going to press the “and” button with the “FundSize-Giant” selected. This will keep only the Fidelity funds that overlap with the Giant funds family (ie… remove all tiny funds, super specific funds, etc).FT Cloud Sieve
  4. Next, we’ll whittle a little more and remove all funds in the “Loads-Front” family by pressing the “Remove-” button with “Loads-Front” selected.
  5. Press the load button in the lower right to load the final 197 funds.

So, to summarize. We used the sieve to remove a variety of “unwanted” funds. We started with the 913 Fidelity family, then we worked our way down to the 197 funds that make the most sense for the fund scan/sieve.


Written by FT Cloud · Categorized: Strategy · Tagged: families, family, investing, knowledge base, sieve, smarts

  • « Go to Previous Page
  • Go to page 1
  • Interim pages omitted …
  • Go to page 5
  • Go to page 6
  • Go to page 7
  • Go to page 8
  • Go to page 9
  • Interim pages omitted …
  • Go to page 11
  • Go to Next Page »

Footer

Contact Us

Investors FastTrack
(866) 295-0166

Investors FastTrack © 2025