The Bogle’s 3 position portfolio, popularized by John Bogle, takes a “simpler is better” approach to portfolio construction.
Basically, the approach calls for only owning three positions via low cost index funds/etfs: total us stock market, total bond market, total international market.
The link above will give all the background on “why,” in this post we’ll just be reviewing how to backtest and analyze the strategy so YOU can make a more informed decision if its right for you.
Step 1:
No credit card is necessary, just a valid email address.
Step 2: The Three Funds
To select the three vanguard funds to use in our analysis, we used the FT Cloud family Sieve (https://investorsfasttrack.com/help/spreadsheet/sieve/) to filter Vanguard funds by size and strategy.
We landed on:
- US Stocks – VTSMX – Vanguard Total Stock Markets Index
- Bonds – VBTLX – Vanguard Total Bond Market Index
- International – VGTSX – Vanguard Total Intern’l Stock Index
Step 3: Build the Portfolio

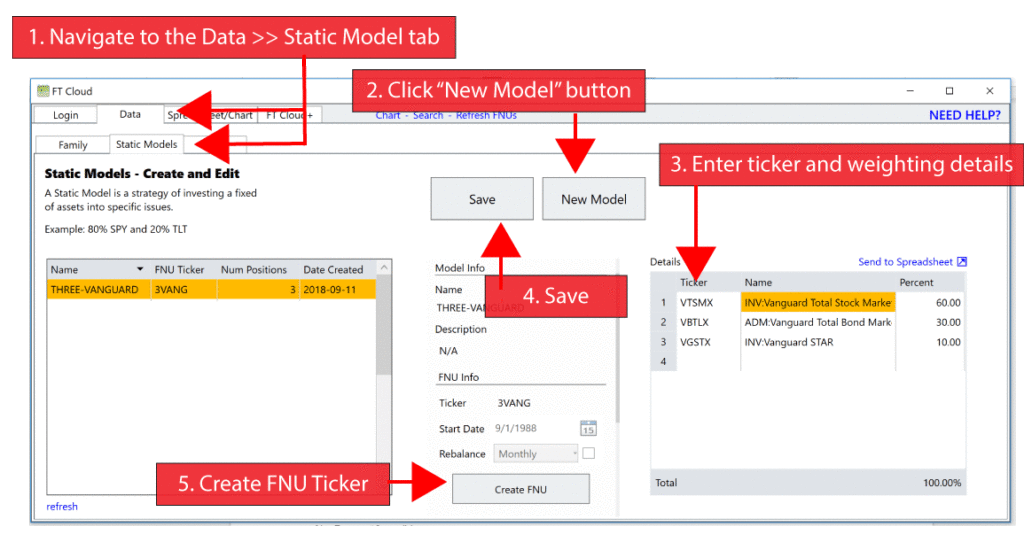
Next, we’re going to build our three fund portfolio and view it on a chart. To start, we need to create an FT Cloud Static Model (https://investorsfasttrack.com/help/other/static-model/) This is a simple set of instructions FT Cloud will use to chart our three fund portfolio.
For this example, we’ll weight 60/30/10 across the above tickers.
- VTSMX – US Stocks – 60%
- VBTLX – Bonds – 30%
- VGTSX – International – 10%
Open FT Cloud and log in, then:
- Navigate to the Data >> Static Model tab
- Click “New Model” button
- Enter above tickers and weightings into “Details” grid on the right
- Press “Save” in top center
- Click “Create FNU” button in center column
The actions above will create a new ticker in the database. This ticker is the result of owning the tickers above, at the above weightings, rebalanced once a month (update the “Rebalance” drop down on the static model tab to change the rebalance setting.)
Step 4 – Chart Results

Now comes the fun part. Our new ticker is 3VANG (Click “edit” on the static model tab to edit this ticker if you’d like.).
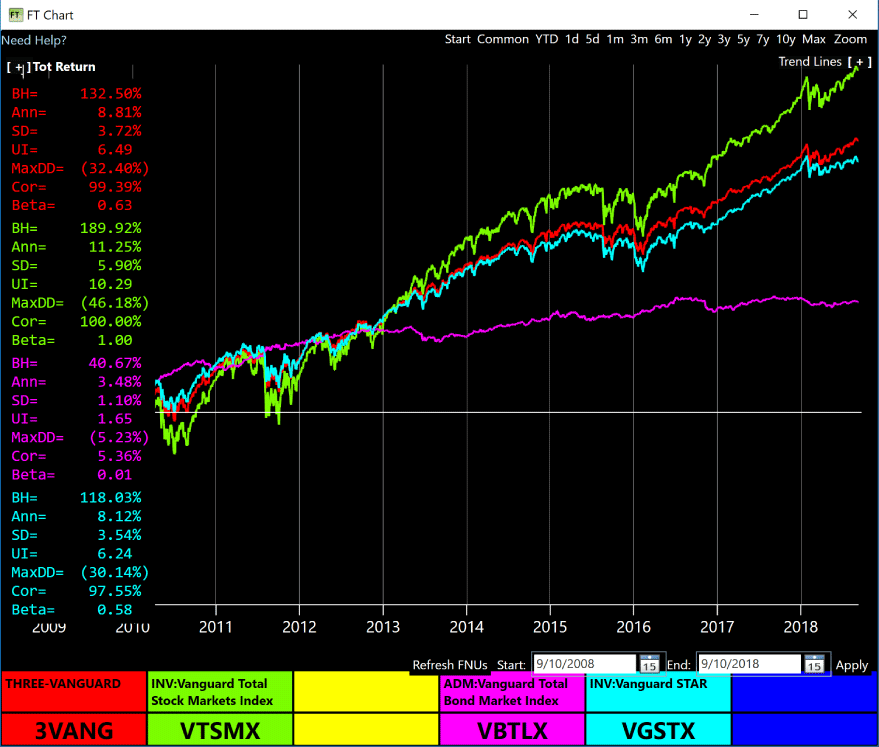
You can now type this ticker anywhere in the FT Cloud product and view/compare the portfolio results. Below is a chart of 3VANG and the components. Click “Chart” in blue at the top of FT Cloud. This is launch a new window that displays the FT Chart.
Analysis
To keep this simple, lets look at return, risk, and correlation. The chart above shows a 10 year time period, 9/10/2008 – 9/10/2018. Important stats for the time period are displayed in the upper left of the chart.
Return – In red we see the three fund portfolio displays an annualized return of 8.46%, compared to the 11.25% of our total market index (VTSMX) in green. So, our red three fund portfolio has 77% of the return of the total market.
Risk – Measuring risk by standard deviation, our three fund portfolio (red) shows 3.95% of the time period vs 5.9% for our total market index (VTSMX) in green. So, our three fund portfolio has approx 66% of the risk of the total market fund.
Correlation – in the FT Chart, correlation is always against the green ticker. So, in the picture above, our red three fund portfolio has a 99.25% correlation to the green total stock market.
Summary
In a few clicks, we easily built a popular and simple investment model. We looked at those result in a chart and compared its risk and performance to the total market.
The stats speak 1000 words. Does this portfolio make sense for your objectives? Does that reduction in risk justify the reduced returns?
It was surprising to see the 99% correlation to VTSMX. The portfolio is 40% bonds and international, yet still correlates highly to the total US market.
Next Steps – Improve
Is it possible to improve the risk return profile by adding 1, 2, 3, 4+ more funds? Is there a fund that can drop the market correlation without hammering returns?
FT Cloud has a whole host of stats, metrics, etc to analyze portfolios. You can pull data up in a spreadsheet, chart, or export it to your software/analysis package of your choice to answer those questions.