Streamline your investment process
No more wasting time switching between applications or copying and pasting data. Easily add mutual fund, ETF, stock, and index price data, calculate statistics, and reference data to any Excel spreadsheets.
Use our 40+, fully documented, custom functions to maximize productivity on Windows, Mac, and browser.
Say goodbye to manual data entry and hello to automated, accurate results.


Comprehensive
With over 40 satistical, pricing, yield, category, reference data function avaiable, you can integrate FastTrack data into the simplest to most complex spreadsheets.
Export
Get the data you need, no middle man. Our excel add in exports raw data directly to excel. Auto update, build macros, run your business.
Integrate
Work where you want and how you want. Fully compatable with Excel on on Windows, Apple, and in the browser.
Data
FastTrack does data. Learn more about our unique, industry leading data collection, correction, and publishing process.
Value
We have plans to accomodate all customers. Starting at $25 a month.
Documentation
Full documentation to help you get started quickly. Start making informed decisions today.


Market Data Coverage
FastTrack’s Market Data API covers all US investable Funds, ETFs, and Stocks. Our data goes back to 1988.
We include 30,000+ open ended mutual funds, 500+ closed end funds, 2,500+ ETFs, 5,000+ stocks, and 1,200+ US and global indexes. We update our catalog daily, pruning discontinued, merged, and liquidated funds while adding all requests and new issues.
FastTrack’s index catalog contains all major market indexes, commodity indexes, international indexes, and more. Notably, FastTrack’s index database contains comprehensive coverage of investment-grade, junk, and emerging market bond indexes.
Supercharge With Exports
Supercharge your data analysis with FastTrack’s investment data add in for Microsoft Excel.
Seamlessly import our accurate and reliable data directly into your spreadsheets, saving you valuable time and effort.
With FastTrack, you have the power to calculate your own statistics, create custom charts, and export data to third-party software, giving you complete control over your investment data.
Say goodbye to tedious manual data entry and hello to effortless, accurate analysis with FastTrack.
Effortlessly Streamline Your Analysis
Unlock the full potential of your investment analysis with FastTrack Market Data Add-in for Microsoft Excel.
With over 40 data, statistical, and reference functions, our add-in puts powerful analytical tools at your fingertips.
Our expert data is injected directly into Excel from our custom functions, making it easy for you to analyze and visualize your investment data like a pro. Plus, our add-in is compatible with Windows, Mac, and browsers, giving you the flexibility to use it on any device.
If you know how to use Excel, you can use FastTrack Market Data Add-in. Get started today and take your investment analysis to the next level.
Pricing
Starting at $25 a month
Upgrade your investment strategy with our powerful FastTrack Market Data Add-in, starting at just $25 a month*. Gain access to thousands of data points for up to 500 stock tickers each month, giving you an unparalleled edge in the market, client presentations, and more.
How it works
Each month, you receive a ticker bucket that can hold up to 500 stock tickers. As you request tickers, they are added to your bucket until you reach the monthly limit of 500. Once you hit the limit, you can still access the data for those tickers, but you won’t be able to add any more until the bucket resets at the beginning of the next month.
Data Coverage
This plan is stocks only. Mutual funds and ETF access requires a FT Cloud or FT4web 2+ database subscription
* $25 a month is based on the annual subscription cost of $300, paid upfront. Monthly subscriptions are $50 monthly.
Pricing
Included with FTCloud/FT4web
Unlimited access is included with all FT Cloud+ and FT4web 2 database subscriptions.
See Pricing options for FTCloud and FT4web

Case Studies
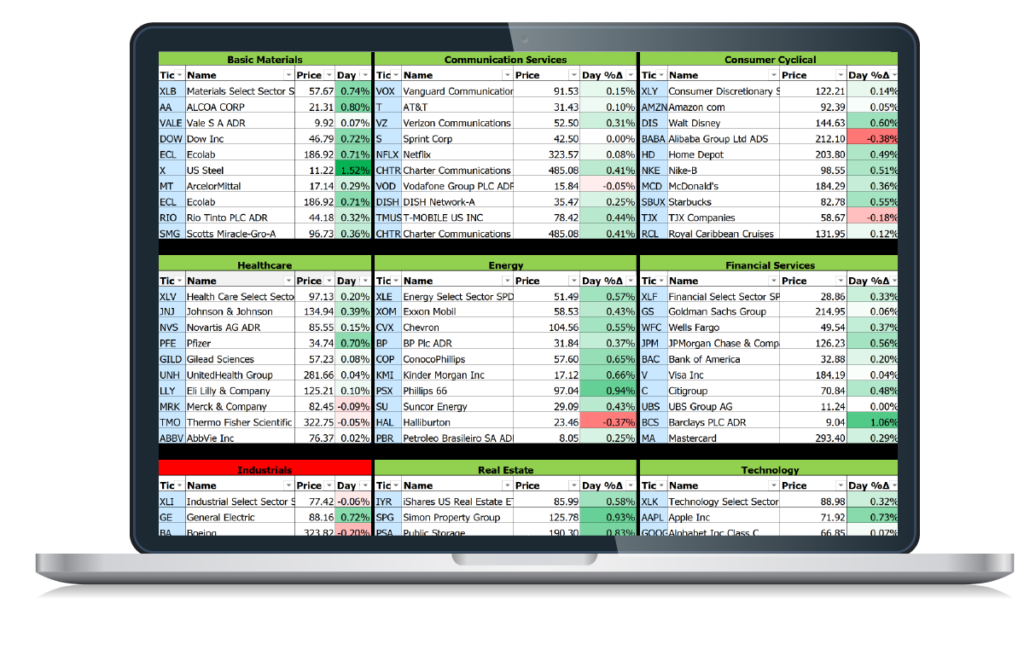
Sector Heat Map
Organize 120 FastTrack tickers into a sector heatmap visualizations.
The template covers 11 sectors, such as Basic Materials, Communication Services, Consumer Cyclical, Tech, and Indexes.
Modify with your own tickers as needed.
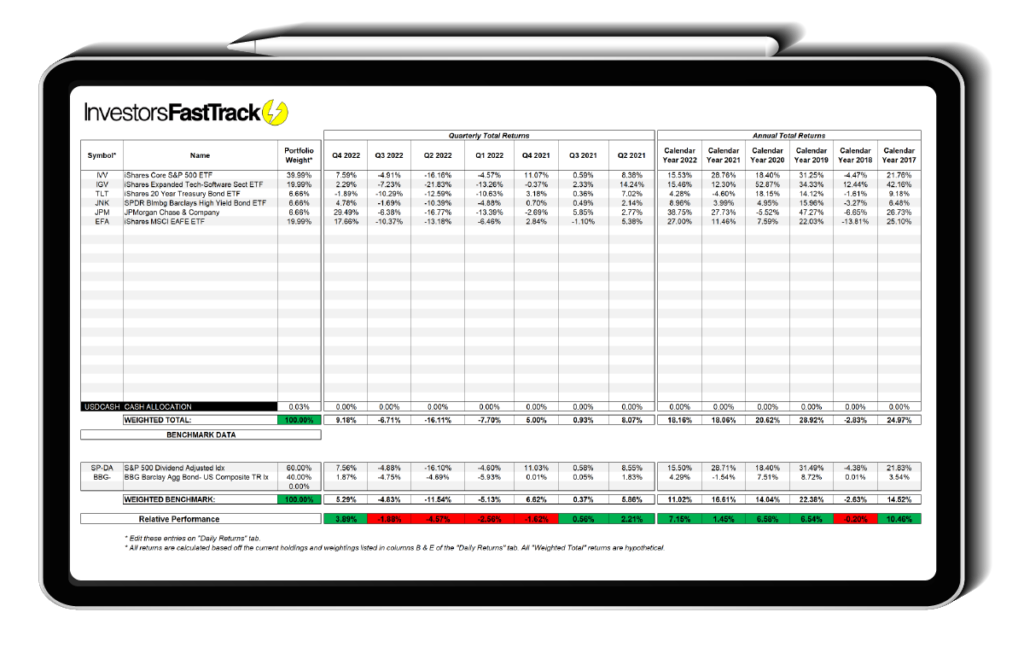
Weighted Portfolio Returns
Compare any portfolio against a single or weighted benchmark.
Add your company’s logo. Format outputs as needed. Run your business using FastTrack’s data.
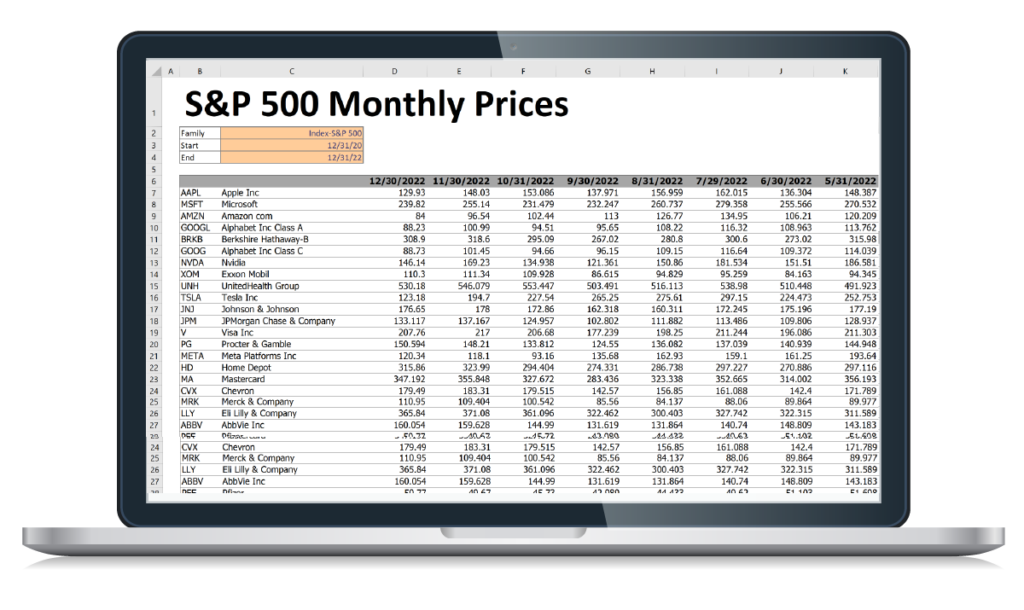
Monthly S&P 500 Price & Return Export
Simple illustration for monthly price and return exports over a date range.
Any prebuild FastTrack family can use this template. This shows the 500+ components of the S&P 500’s monthly price exports.
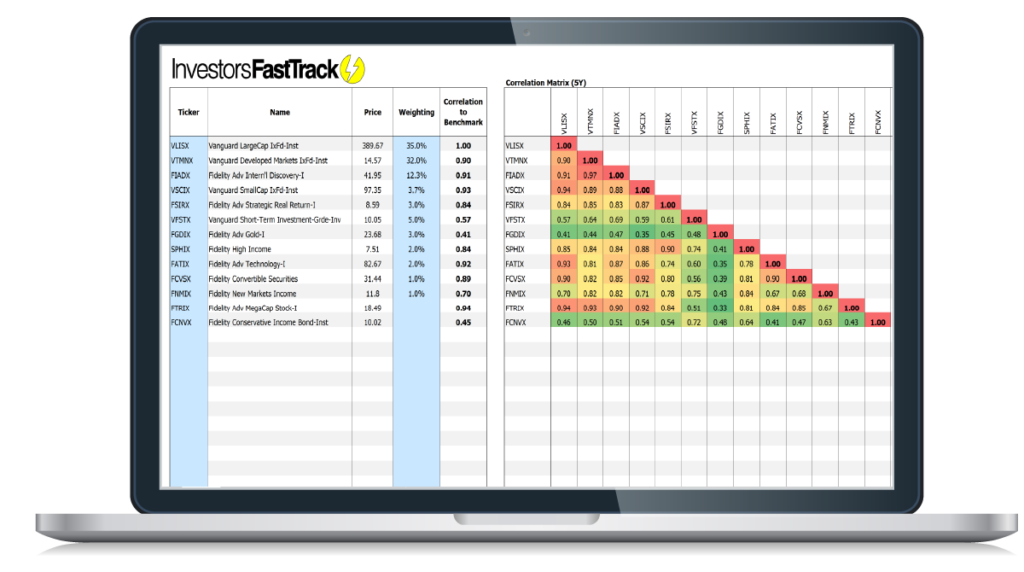
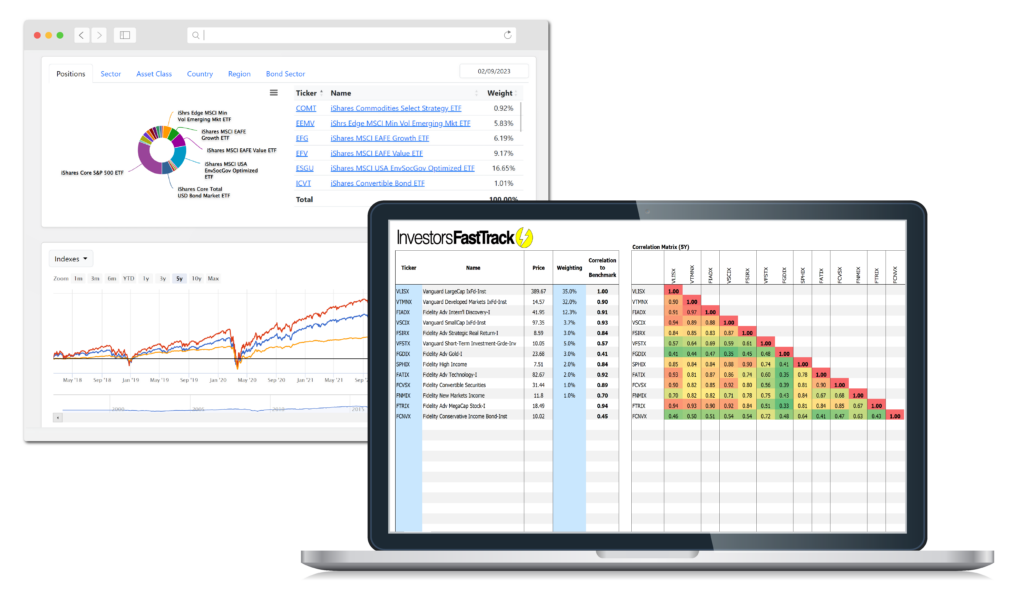
Corrlation Matrix
Are you really diversified. Use the cross-correlation matrix to compare 5-year correlation of each portfolio component.
Simply define the components of your portfolio, then view the heatmap graphic of the portfolio’s cross-correlations.
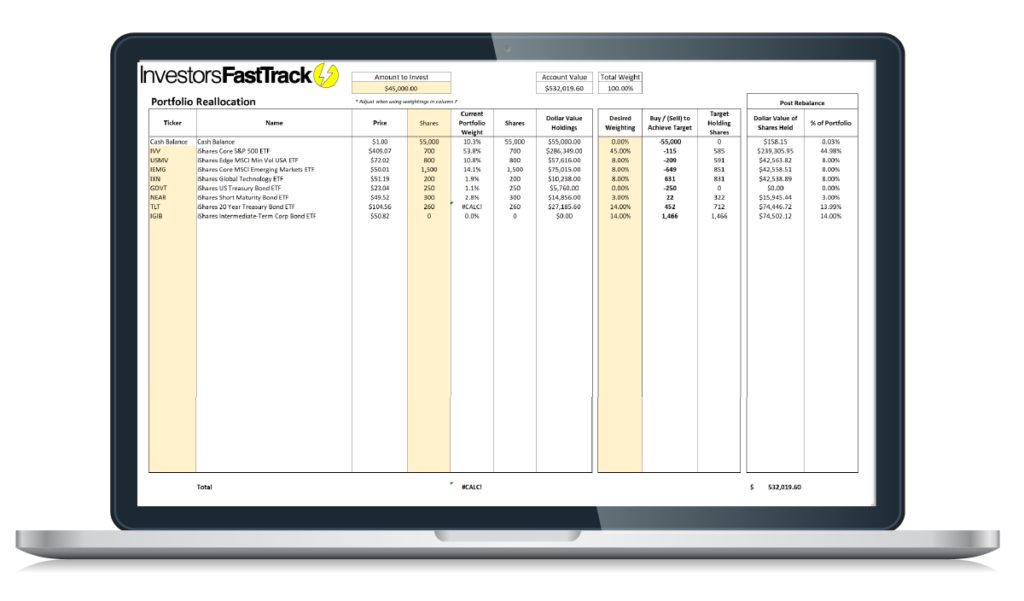
Portfolio Reallocation
Make quick work of periodic rebalancing. Indicates the number of shares to buy and sell for the desired portfolio
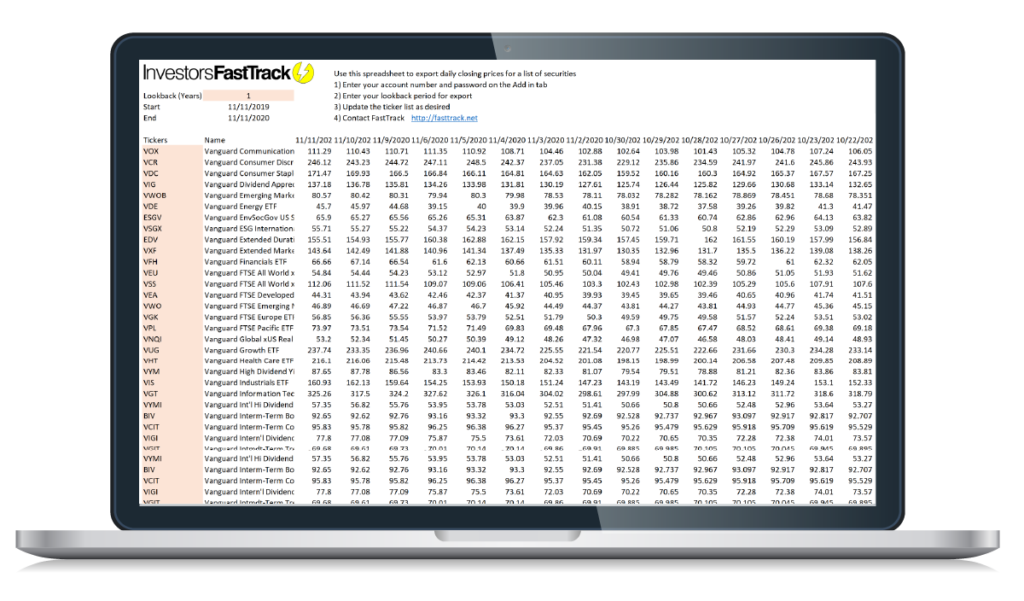
Export Prices
How it works
FastTrack’s Add In creates custom functions that bring in FastTrack market data into excel. The full list of functions is below.
Install From The App Source

Get Free Trial
Review the Function Below
How it works
Available Functions

Important Notes
Dates
- All date values must be referenced from a cell or wrapped in quotes. Ex: "12/31/2019"
Date Defaults
- Any "start" value left blank will default to a trailing 1 year of the most recent date
- Any "end" value left blank will default to the most recent market day
Date Short Codes
Codes: "1M", "3M", "6M", "9M", "12M", "1Y", "2Y", "3Y", "5Y", "10Y", "Y" (YTD)
Example 1
=FastTrack.TotalReturn("JPM","1Y")
=FastTrack.UPI("JPM","3Y")
End date parameters are left blank and defaults to the last day in the database
Example 2
=FastTrack.UPI("JPM")
End date and Start date parameters are left blank. Start defaults to 12 months from End date. End Date is left empty so it defaults to last day in the database
Volitile Functions
All the functions in the FastTrack Excel Add-in are non-volatile. This means the functions only recalculate when inputs (parameters) of the function are changed. Volatile functions recalculate when ANY cell changes (if you have lots of formulas always recalculating in your workbook, this can be VERY slow).
Use Ctrl + Alt + Shift + F9 to "Force Recalculate" FastTrack Excel Add-in functions.
Alternatively, add a Volitile function (such as =Today()) to any date parameter in the function and FastTrack's Excel Add In's custom fuction will act volitile (due to the volitile input as a date)
Both formulas below produce the same 1 year trailing return value.
Non volitile Trailing 1 year total return
=FastTrack.TotalReturn("JPM","1Y")
Volitile Trailing 1 year total return
=FastTrack.TotalReturn("JPM","1Y",Today())