Model Portfolios: Your Investing Edge
Seamlessly analyze, optimize, and manage your portfolios.
Unlock unparalleled precision in risk reduction and strategy.
Understand your Portfolio
Empower Client Conversations with Tangible Insights.
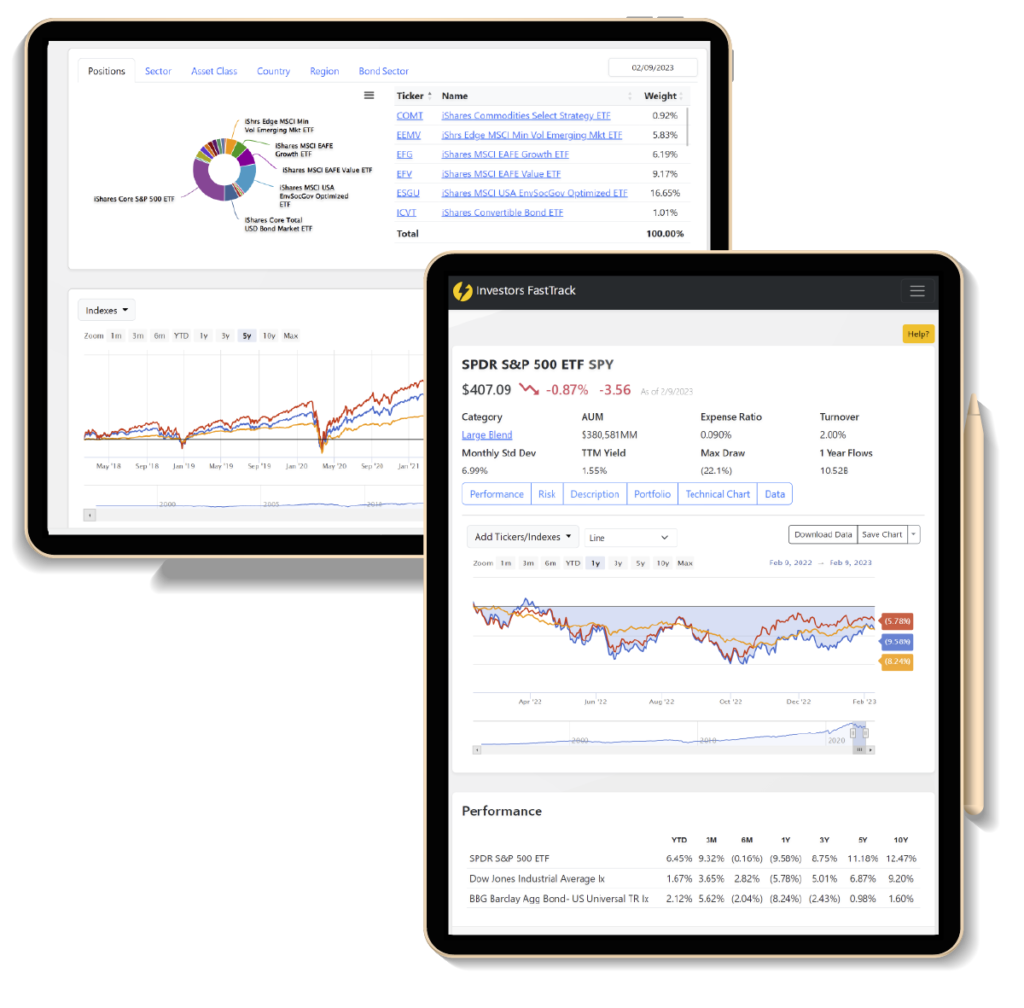
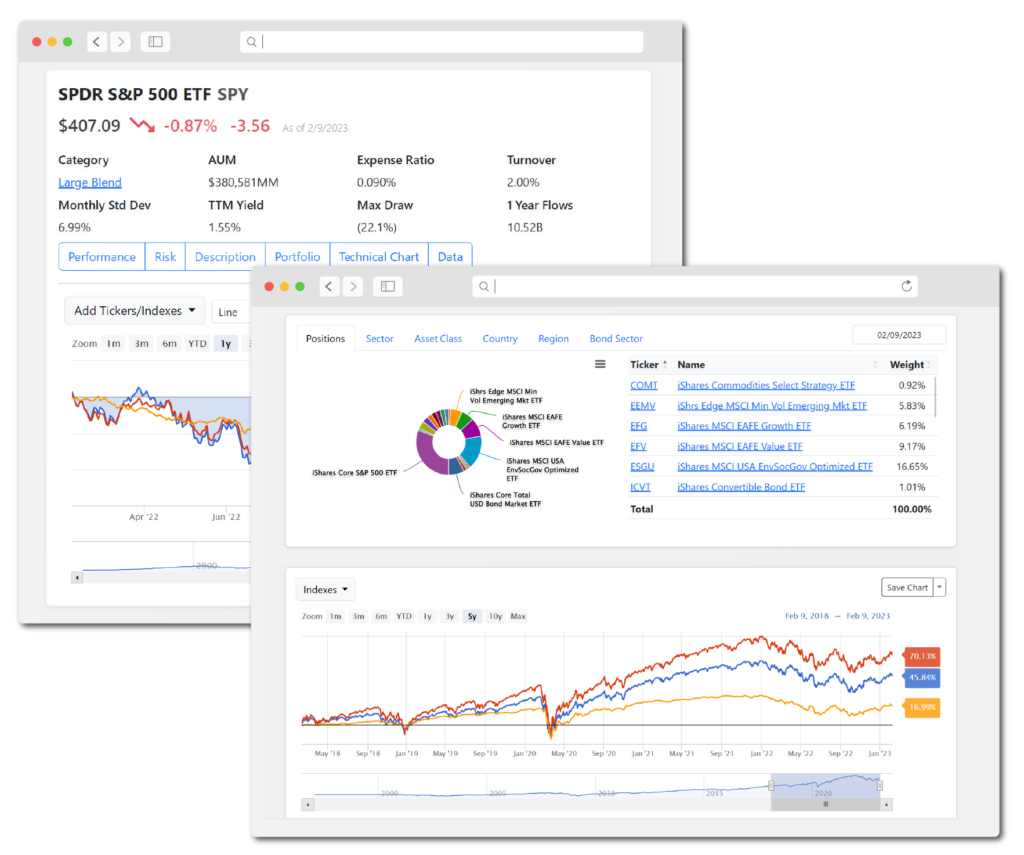
Dive into our visualization tools tailored for model portfolios. Craft vivid charts and detailed reports that not only bolster client trust but spotlight your unique investment strategies. Equip yourself with every essential metric and ratio to ensure informed portfolio discussions.
Win Trust through Strategic Comparisons
Leverage Precision in Model Portfolio Showcases.
Let your model portfolios speak for themselves. Seamlessly contrast them with a client’s current portfolio to spotlight your edge. Whether you prefer custom presentations or our expert templates, every report can be branded uniquely as yours, emphasizing the prowess of your model portfolios.
Gain an Edge with Performance Rankings
Uncover the Drivers Behind Your Portfolio Success.
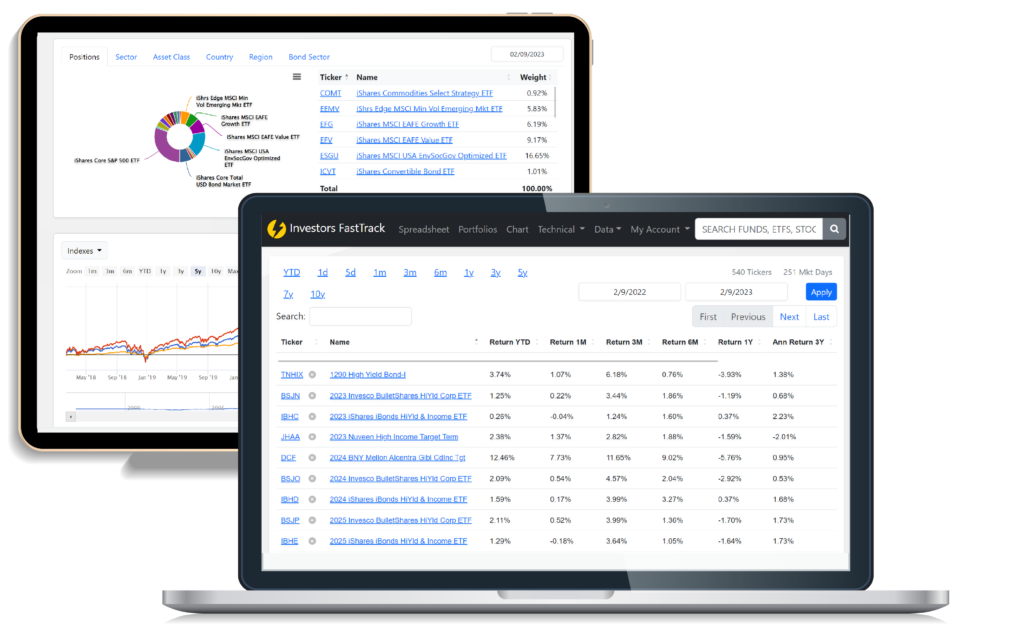
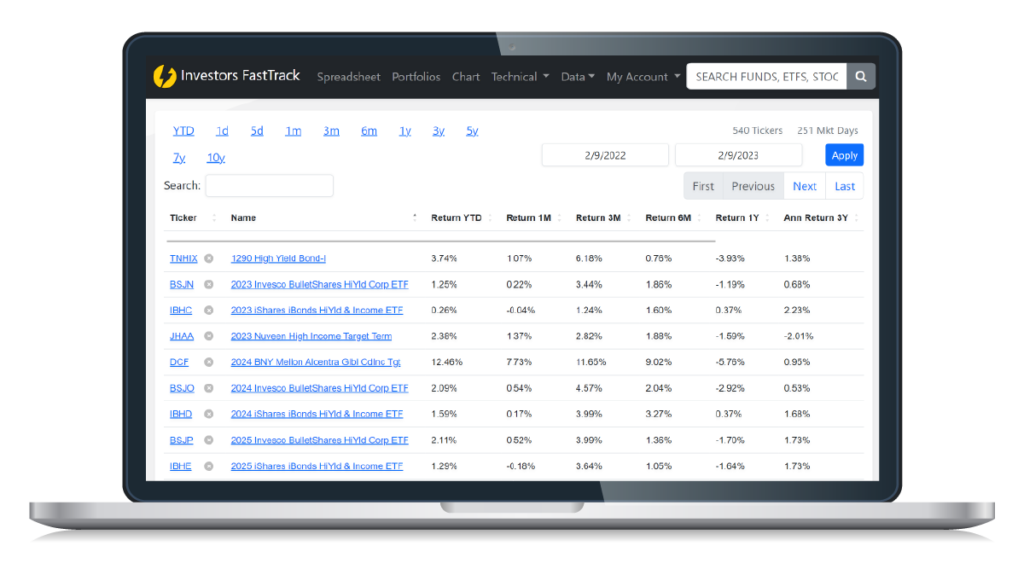
Integrate your model portfolios in our Spreadsheet and witness them shine against any security. Dive deep to discover the key investment driving performance, risk, and more, making sure your investment decisions are backed by concrete data.
Design Tailored Benchmarks
Precision-Driven Benchmarks for Accurate Analyses.
Customize benchmarks that speak to your clients’ aspirations. Combine varied assets, be it indexes, stocks, or ETFs, to craft benchmarks that truly represent your investment ethos.
Master the Art of Portfolio Allocation
Unfold Allocation Mysteries for Stronger Strategy.
Thrive as an investment maven by embracing a holistic view of your model portfolio’s allocation. Understand portfolio details from diverse angles, pinpoint strengths, and areas of improvement, and ensure a balanced exposure to assets, sectors, and regions. Dive deep into every position to grasp its historical dynamics, aligning your strategy for future success.
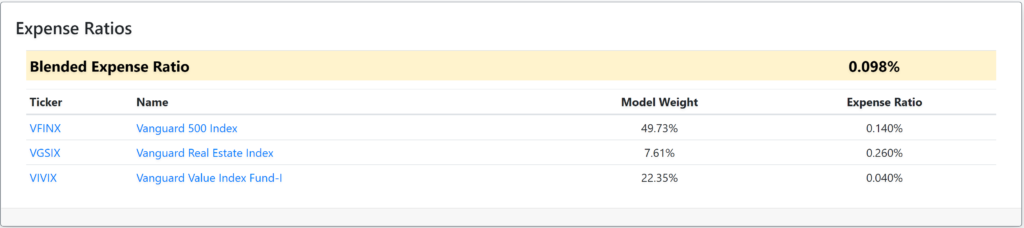
Decode the Expense Matrix
Elevate Returns by Understanding Expense Dynamics.
Let our blended expense ratio illuminate the cost impacts on your returns. Understand which positions heavily influence expenses and strategically maneuver to maximize your investment performance.