Quickly Ranking Large Amounts of Data for Custom Collateral
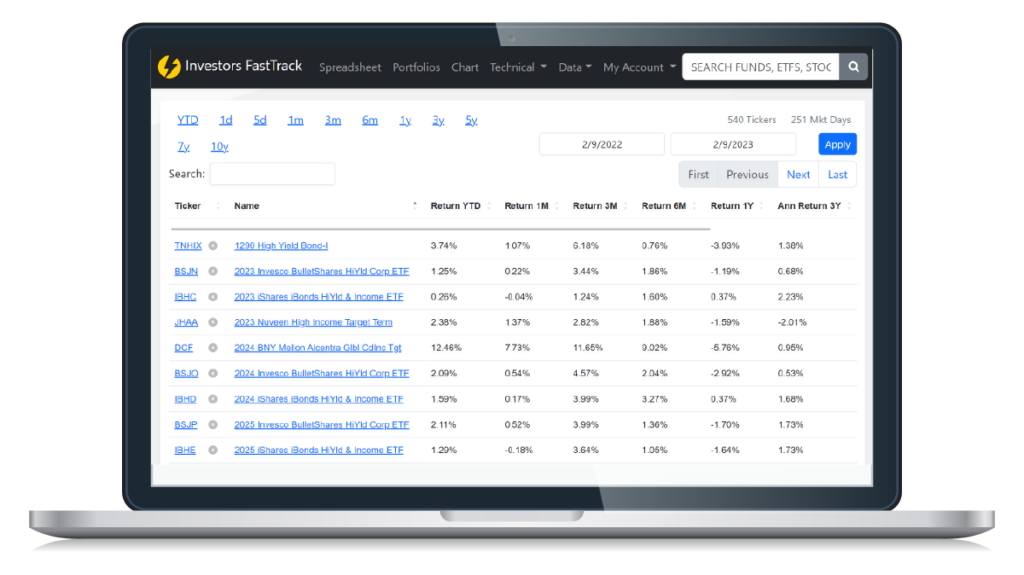
As an investment professional, you need to analyze and rank large amounts of data to make informed decisions and communicate effectively with clients, colleagues, and prospects.
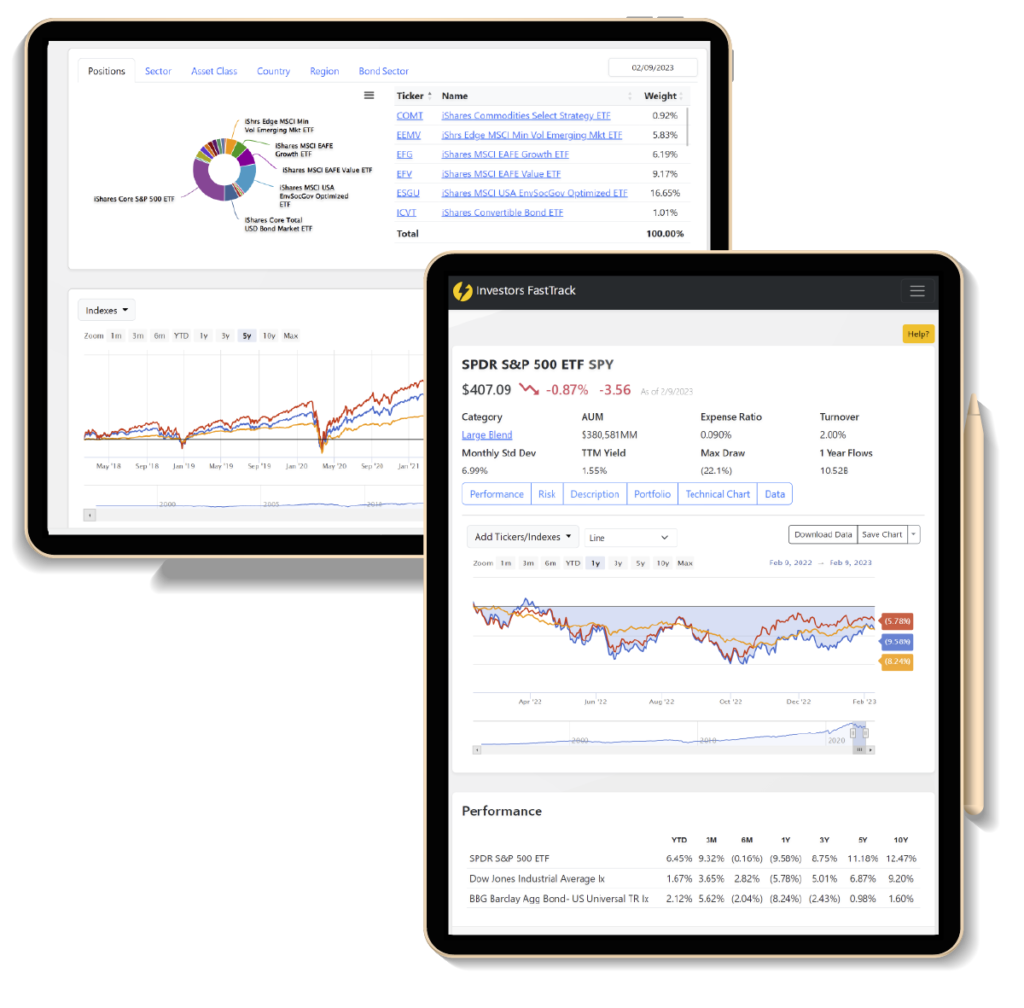
FastTrack can help you to streamline this process by quickly sorting, filtering, and ranking data to identify key trends and opportunities.
With the right tools, you can easily generate custom reports, tear sheets, and collateral that highlight your investment strategies, performance metrics, and other key data points that your clients care about.
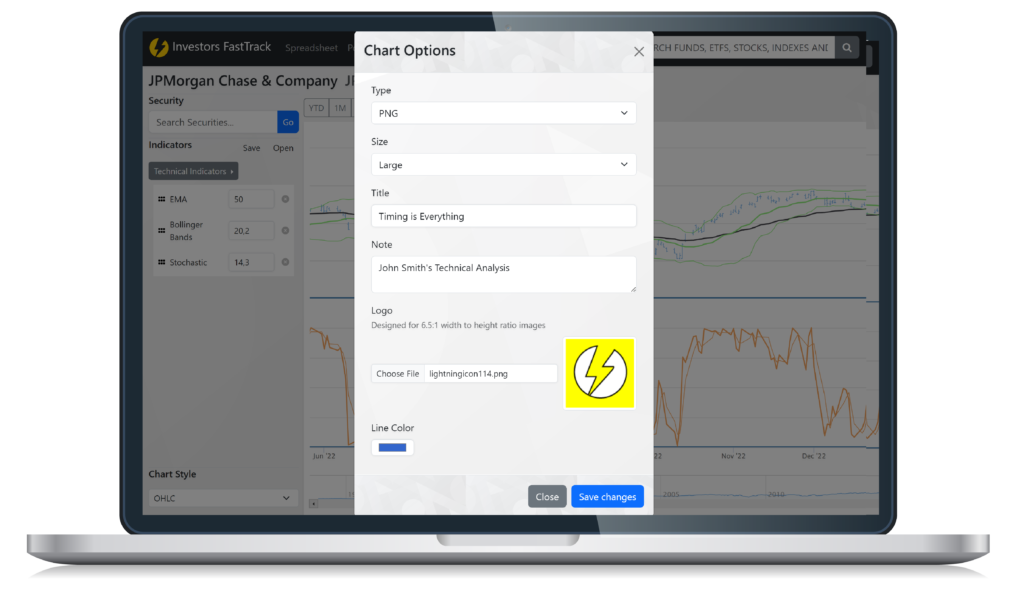
Adding Branded Charts to Blog Posts, Social Media, or Newsletters
In today’s digital age, it’s essential to have a strong online presence and be able to share ideas and insights with clients, colleagues, and prospects.
FastTrack products can help you to create branded charts and graphs that can be easily incorporated into blog posts, social media, or newsletters. This can help you to build your brand, attract new clients, and demonstrate your expertise.


Streamline with User-Friendly Tools
Spreadsheets have long been a staple of financial analysis, but they can be time-consuming and error-prone.
FastTrack’s tools offers a more efficient and user-friendly alternative that can help you to streamline your workflows and improve your productivity. With the right tools, you can quickly analyze data, create custom reports, and share ideas with clients, colleagues, and prospects, all while minimizing the risk of errors and improving the quality of your work.
By moving away from spreadsheets and embracing user-friendly financial software, you can stay ahead of the competition and grow your business in today’s rapidly evolving financial services industry.
Ready to take your next step?
Grow your AUM and convert more prospects