• Skip to main content
  • Skip to footer

Investors FastTrack

Quality Data for Investing Strategies

  • Solutions
    • Advisors
    • Individuals
    • Businesses
  • Product
    • Tools
    • Data
    • FT4WEB
  • Plans
    • Subscriptions
    • Customer Service
  • Resources
    • Download
    • Investing Math
    • FT Comm Manual
    • FT Cloud Manual
    • Videos
    • Data Status
  • About Us
  • Current Subscribers
  • (866) 295-0166

etf

Mar 26 2018

Smart Beta and High Yield

We’re highlighting smart beta and actively managed ETFs again this week. While still a small portion of the overall market (see the attached article), increased market volatility and rising interest rates are bringing investor interest back to active.

For now, mostly in bond products, but re: the attached article, international and emerging market products are picking up, with $239 billion in fund flows last year vs $692 billion flowing into passively managed funds

Here’s how you would use FT Cloud to investigate the investment prospects of the active high yield funds highlighted in the article.

  1. Load spreadsheet and click “Load Family” in upper right. 
  2. Expand the tree to “Funds & ETFs” >> “Fixed Income” >> High Yield. Double click high yield to load all high yield tickers into the grid on the right.  
  3. Next, expand “Funds & ETFs”>> “Company”>> “ETF.” Then single click “All-ETF” and the press the “And” button on the upper right. This remove any tickers that are not in both the “High Yield” and “All ETF” family. This will leave us with only the High Yield ETFs.
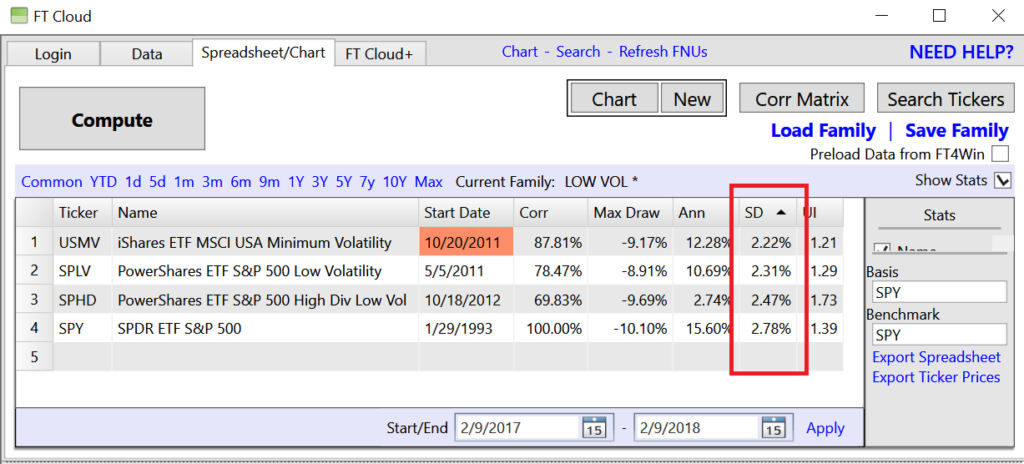
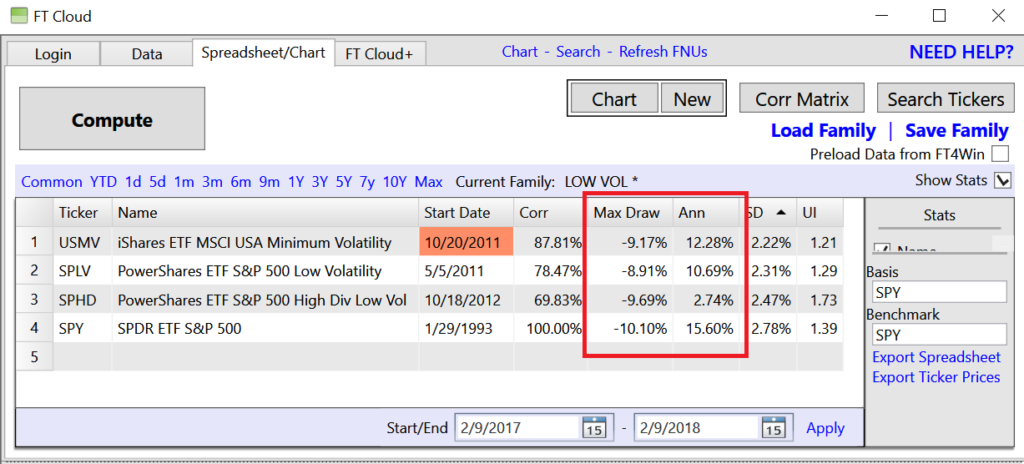
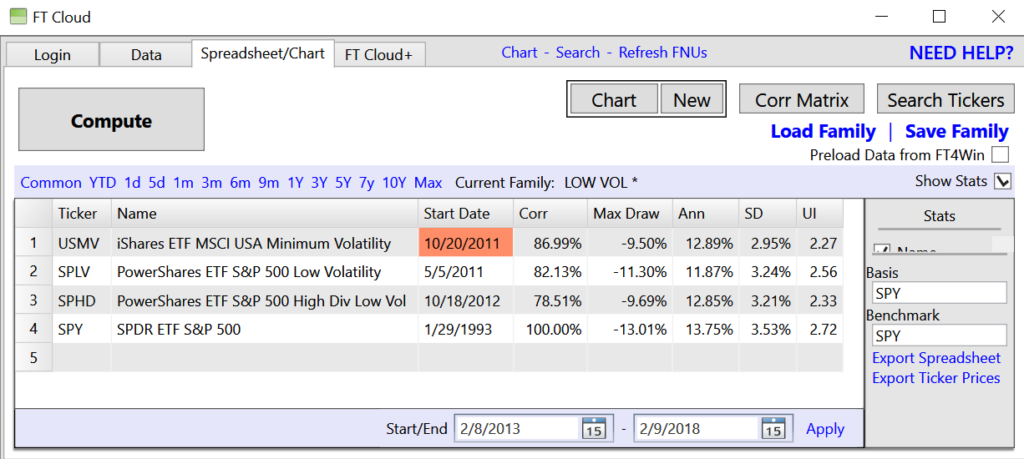
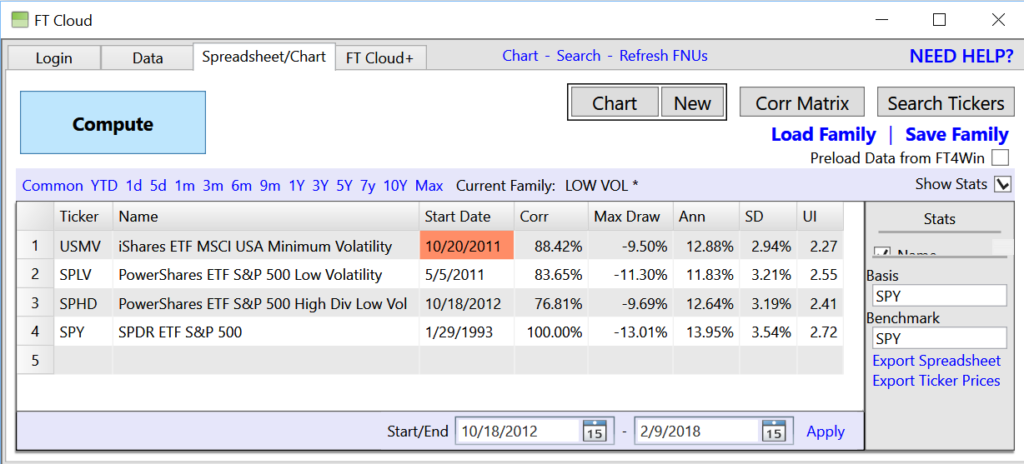
  4. Next click load and start analyzing the ETFs in the spreadsheet. Rank by risk, return, correlation, and performance compared to the benchmark. See last weeks article on how to choose a benchmark (https://goo.gl/fCQgHd)

https://www.cnbc.com/2018/03/19/seeking-downside-protection-investors-check-actively-managed-etfs.html

Written by FT Cloud · Categorized: Family, Market Commentary, Strategy · Tagged: commentary, etf, investing, knowledge base, smart beta, smarts, spreadsheet, strategic beta

Mar 19 2018

How to Choose an Benchmark – Market Indexes

We get lots of questions about indexes, specifically what are the appropriate indexes to use on the spreadsheet benchmark field. The short answer is… for US Equities use an US equity benchmark (SP-DA – S&P 500 div adjusted) and bonds use a bond benchmark (AGG-X – Barclays Aggregate Bond Ix) .

But, if you’re doing a more specific analysis, use a more specific index. For example:

High Yield: MLHY- Merrill Lynch US HY Master II H0A0 Index
Financial Equities: IYF-X ETFINDEX Financial Index
Preferreds: PFF-X ETFINDEX S&P US Preferred Stock Ix
Semiconductors: SCY-X ETFINDEX Semiconductor Index
BioTech – DJ-BT Indexfam DJ US Biotechnology Index
Global STocks – DJW-X Indexfam DJ Global Index
China – DJ-CB Indexfam DJ China Broad Market Index

FastTrack’s got an index family that lists all indexes in the database. Today we have over 400 and are adding more as they appear. Also, in FT Cloud you can click the “search” link at the top of every page to open the search window. There are you can ticker and key word search all indexes (as well as the rest of the database.)

While we’re on the topic of indexes, here’s an interesting article on the makeup of the popular AGG Aggregate bond index. Below is a great quote from the article. Like many traditional indexes, AGG is a market cap weighted index. While we all can understand this in equities (larger the value of combined equity the larger the weighting). For bonds though, it’s the larger the total outstanding debt, the larger the weighting. So… more debt (and sometimes leverage), the higher the weighting. Its not quite the same math.

“If you think about the construction of traditional indices, a market-cap weighting structure. It makes more sense in equities. On the bond side, it gets a lot harder. A market-cap weighting system where you give the highest weight to the most indebted issuers is not ideal,” ….

https://www.marketwatch.com/story/are-investors-getting-more-risk-with-passive-bond-funds-than-they-bargained-for-bis-asks-2018-03-14

Written by FT Cloud · Categorized: Market Commentary, Strategy · Tagged: benchmark, commentary, etf, investing, knowledge base, market index

Feb 20 2018

Charting Bitcoin with FastTrack

Bitcoin graphic fasttrack

Bitcoin is back on the front page, breaking above above the $10k mark again last week. While its a speculative asset class and typically not something a FastTracker would devote much capital, we have been getting a good number of calls about Bitcoin, Blockchain, and related tech.

What do we think, worth a gamble?

He’re a quick list below of most popular/ asked about ETFs, Funds, and stocks. Look out for the bitcoin family coming soon.

Bitcoin/ Cryptocurrency/ Blockchain
GBTC – Bitcoin Investment Trust
ARKW – ARK Web x.0 ETF
ARKK – ARK Innovation ETF
BLOK – Amplify Transformational Data S ETF
BLCN – Reality Shares ETF Nasdaq NextGen E
KOIN – Innovation Shares NextGen Protocol ETF
LEGR – First Trust Indxx Invtv Tnsctn&Prcs ETF
KOIN – Innovation Shares NextGen Protocol ETF

Stocks
LBCC – Long Blockchain Corp
OSTK – Overstock
RIOT – Riot Blockchain
KODK – Eastman Kodak Co
MGI – MoneyGram International
NVDA – Nvidia

Written by FT Cloud · Categorized: Data News, Market Commentary · Tagged: bitcoin, blockchain, etf, investing, new tickers

Feb 12 2018

How are low volatility ETFs holding up?

How are low volatility ETFs holding up?

Over the past 5+ years, a variety of low volatility equity ETFs have launched with rapid growth. In light of the recent market volatility, how are the funds holding up? The top three are listed below and have a combined AUM of $24 billion:

  • SPHD – PowerShares ETF S&P 500 High Div Low Vol
  • SPLV – PowerShares ETF S&P 500 Low Volatility
  • USVM – iShares ETF MSCI USA Minimum Volatility

The FT Cloud SpreadSheet below highlights that the dividend adjusted stand deviations are in fact lower than SPY. So, the funds are producing the described lower volatility.

But what do we think about recent max drawdown numbers and the trailing 12 month returns? The picture below highlights the trailing 12 months total returns and recent draw down. While the ETFs are producing only 80-90% of SPY’s monthly volatility, they’re producing 90%+ of the drawdowns and a mere 20-80% of the returns.

Over the longer term (3 year, 5 year, and common start date), the ETFs are showing consistent lower SD while maintaining comparable annualized returns. See the three year, 5 year, and common start date views below.

Are these worth holding in your portfolio? We’ve love to hear your thoughts.

Three Years (Feb 2015- Feb 2018)
Five Years Feb (2013- Feb 2018)
Common Start (Oct 2012- Feb 2018)
One Year Total Return (Feb 2017 – Feb 2018)

Written by FT Cloud · Categorized: Market Commentary, Strategy · Tagged: commentary, etf, investing, low vol

Oct 09 2015

Correlation Study – Investing in Fear

Investing in fearWe had a great tech support call come in today. A long time FastTracker has been “tracking the VIX” and looking to get direct exposure to the index. He asked, “what’s the ticker to buy the VIX?”

Well, the answer is simple, but first let’s go through some background. The VIX is an index, more specifically its the CBOE Volatility Index (FastTrack ticker VIX-X). The vix usually referred to as the “fear index” and typically tracks opposite to the overall market. An investor would look for exposure to the VIX to capitalize on market downtrends.

That being said, the VIX is still an index. So… you cannot buy it directly. You must buy an ETF or mutual fund that tracks the VIX index. So, how do you use FT Cloud or FT4web to find these ETFs? Its simple, we’ll do a correlation analysis with the spreadsheet. We’re going to look for all and any fund in the FastTrack database that is highly correlated to the CBOE VIX index.

Note: We could search ticker names, google search, or something similar. But if you’ve used FastTrack techniques and products, you’re well aware that names are some of the least informative aspects of a security. Just because you call yourself a “VIX ETF,” doesn’t mean you are a VIX ETF. The score board (past performance) says it all. 

Here’s a step by step to find the ETF that track the VIX.

  1. First we’re going to load all the ETFs in the FastTrack database. Log in to FT Cloud, click on the FT Cloud spreadsheet tab, in the upper right corner, click the “load family” button. Investing in the VIX
  2. Next, navigate to the All ETF family. Its located under the Funds > Companies > ETFs > All ETFs. Double click the family, then click load in the lower right of the load window.Investing in the VIX
  3. Now, to run our correlation study, we’re going to find all the ETFs that have a high correlation to the CBOE VIX Index. In FastTrack the CBOE VIX index uses the ticker VIX-X (We used the ticker search feature to find the index). The correlation column on the spreadsheet correlates to the “benchmark” field. So, we’re going to type VIX-X into the benchmark field and change our dates to a one year time period (this example uses a one year correlation study… but you can alter the date ranges for different studies)Investing in the VIX
  4. After we press the “Compute” button in the upper left corner, the spreadsheet will fill with the calculations we need for the study. Next, we are going to click the “Corr” header to sort the spread sheet from highest correlation to lowest correlation. (Click the Correlation check box in the “stats” list on the right hand side to show the correlation column on the spreadsheet.)Investing in the VIX
  5. There we have it. While there’s no perfect 100% correlation, we get pretty close with 91%-88% range over one year.

So, to summarize, to find an ETF, or in this case ETFs and ETNs, that track the CBOE VIX index, we do a simple correlation study. This study shows us that we don’t have an instrument that tracks the CBOE VIX index exactly, but we’ve got a handful of ETFs and ETNs that get pretty darn close.

Results: The we derived the following one year correlations to FT ticker VIX-X

  • VIXY – ProShares VIX Short-Term Futures- 91%
  • VIIX- VelocityShares VIX ST ETN – 90.89%
  • UVXY – ProShares Ultra VIX Short-Term Futures – 90.59%
  • TVIX – VelocityShares Daily 2x VIX ST ETN – 89.53%

Written by FT Cloud · Categorized: Market Commentary, Strategy · Tagged: CBOE, correlation, etf, ft4web, spreadsheet, VIX

  • Go to page 1
  • Go to page 2
  • Go to Next Page »

Footer

Contact Us

Investors FastTrack
(866) 295-0166

Investors FastTrack © 2025