• Skip to main content
  • Skip to footer

Investors FastTrack

Quality Data for Investing Strategies

  • Solutions
    • Advisors
    • Individuals
    • Businesses
  • Product
    • Tools
    • Data
    • FT4WEB
  • Plans
    • Subscriptions
    • Customer Service
  • Resources
    • Download
    • Investing Math
    • FT Comm Manual
    • FT Cloud Manual
    • Videos
    • Data Status
  • About Us
  • Current Subscribers
  • (866) 295-0166

simple strategy

Jan 04 2022

Creating Leveraged Investment Portfolios

Leveraging Investment Portfolios

Summary

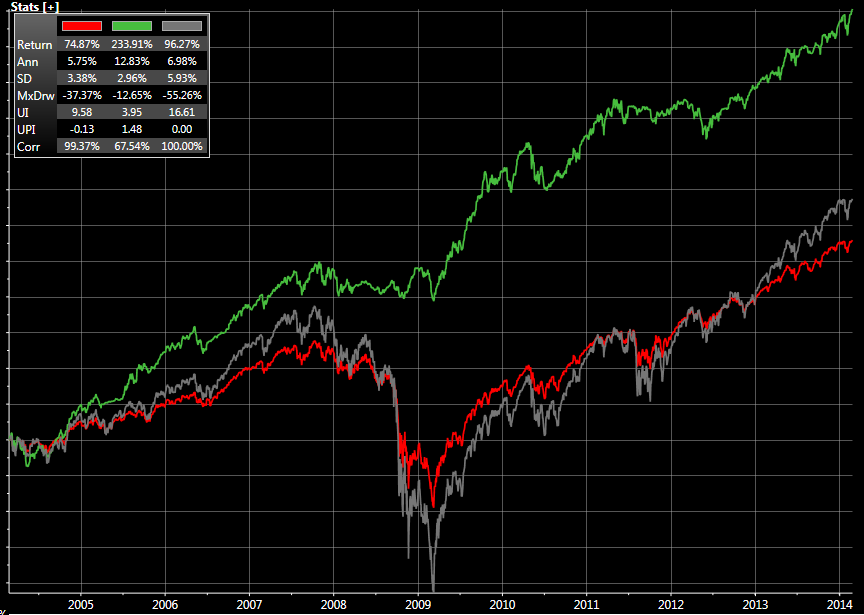
In this post, we’ll model a 1x leveraged investment portfolio of JNK – SPDR Blmbg Barclays High Yield Bond ETF. Next, we’ll model using a 50 / 200 moving average of JNK to add and remove the leverage.

Said in simple terms, we’ll leverage the portfolio when the 50 day is over the 200 day average. When the 50 day drops below the 200, we’ll de-lever and just hold JNK.

All modeling is done with FT Cloud and FTCloud’s static model. Watch a quick overview of the Static Model here. Sign up for a free trial here:

Start your 14 day Free Trial

What is Leverage

Leveraging a portfolio is when an investor borrows money to purchase securities. If the securities purchased with borrowed money appreciate, you enhance your profits without using your own capital. If the purchased securities produce a loss, you repay the debt at par and magnify the loss on investment.

Fire In Your Living Room

Leverage can greatly magnify gains and losses. Certain investors live and die by leverage, but it’s not something to employ lightly. I recently had a user describe it to me like this: “It’s like building a fire in the middle of your living room. While that fire will heat your house and keep you warm, if you don’t keep on top of it will burn the place down.”

Modeling Leverage

We’ll jump right into FT Cloud. We’ll use the Static Model to accomplish our goals.

Leverage Mutual Fund and ETF portfolios

First, navigate to the (1) Data >> Static Model tab. Then look in the (2) lower middle of the screen for the leverage details. The leverage info gives you the % leverage, margin rate, and % cash in the portfolio.

Leverage Mutual Fund and ETF portfolios

To create a leveraged model, allocate weighting to the portfolio that adds to more than 100%. The above picture shows an example portfolio with a 250% allocation.

Relating this to a $100,000 portfolio, the above example would have the following positions:

SPY – $150,000
TLT – $100,000
Total – $250,000

Margin Rate

The margin rate is the cost of borrowing funds. This is expressed in an annual percentage rate. The interest compounds each time the portfolio rebalanced. A monthly rebalance has monthly compounding interest and a weekly model has weekly compounding interest.

Set the global margin rate on the Login>>Advanced Options screen.

Leverage is the total leverage on the portfolio. In the above 250% leverage example, $100,000 is the original capital position, and the $150,000 is the leveraged position. $150,000 / $250,000 = 150% leverage.

The cash position is the balance in cash for any models that have under 100% allocations. A model with a single SPY position of 80% will show a cash position of 20%.

Calculate the Portfolio

Once we have our details dialed in, we need to crunch the portfolio. In FT Cloud, we’ll create an FNU by clicking the “Create FNU” button.

This saves an FNU file to your local disk and adds a new ticker to your FT Cloud database. The value in the “ticker” field is used as the portfolio’s new ticker. Use this ticker anywhere in FT Cloud.

Checking the Work

Open Log will open the windows folder where all leveraged model logs are stored. The leverage log is a .CSV file that has the following columns:

  • Date – Market date of values
  • Non Levered Portfolio – value of the underlying non-levered static model. In the above 250% example, this would be the values of a 60% SPY, 40% TLT portfolio. To calculate the model FT Cloud creates a non levered static model with the following weightings: $150k / $250k = 60% SPY and $100k / $250k = 40% TLT portfolio. Once this 60/40 portfolio is calculated, then FT Cloud applies 150% leverage to the 60/40 portfolio.
  • Running Total Non Levered Portfolio – The daily value of the un-levered portion of the portfolio. This is a “show your work” value. It acts oddly by jumping in value at the beginning of every month. This is due to the resetting of the un-levered value to the previous day’s [Levered Portfolio Value] (plus the day’s price change)
  • Original Borrowed Amount – the amount borrowed at the beginning of the investment period. This value resets every time the portfolio is rebalanced. This value change does not change throughout the period. ie. you borrow a fixed dollar amount on the first day of the month, then repay that same fixed dollar amount at the end of the period.
  • Borrowed Amount Value – the daily value of the borrowed funds. On the first day, the original borrowed amount is invested with the same allocations as the nonlevered portfolio. Each day the [Borrowed Amount Value] changes according to the change of the [Non Levered Portfolio]
  • Period Cost – the fractional portion of the annual interest charged over the investment period. This also remains unchanged during the period. Since we borrow a fixed value on day 1, the interest is charged off that fixed value. This is calculated as:
    ( [margin rate] / [rebalance frequency] ) * [Original Borrowed Amount]
  • Daily Cost – the period cost divided by the number of market days in the investment period. For the same reasons, this value does not change during the investment period.
  • Net Return on Borrowed Amount – This is the result of the following equation:
    [Borrowed Amount Value] – [Original Borrowed Amount] – [Daily Cost]
  • Levered Portfolio Value – This is the result of the following equation:
    ( [Previous Day Running Total Non Levered Portfolio] * [Daily return of Non Levered Portfolio] ) + [ Net Return on Borrowed Amount]

Click the link below for a google sheet log of the above leverage model. Columns A-I shows the regular log values. Columns K-Q show the work of how the values are derived.

https://docs.google.com/spreadsheets/d/1WSRegP95Hz_BbEaSQj1-psvlRfmmH0nxusy5zA1IeOE/edit?usp=sharing

Written by FT Cloud · Categorized: Strategy · Tagged: investing, knowledge base, leverage, simple strategy, smarts

Jun 12 2014

Why Do Dividends Adjustments Matter?

FastTrack has been the premier provider of quality dividend adjusted ETF, fund, and stock data for many years. Serious investors know why dividends are critical. But, here’s a quick crash course in a few charts.

The 10 year chart below demonstrates the difference between dividend adjusted return vs non dividend adjusted return for VUSTX (Vanguard INV:Long-Term US Treasury).

This fund is one of the top five US funds in total assets (thus very popular and not picked to exaggerate the example)

vustx Div Comparison

The blue line represents VUSTX with no dividend adjustment and the gold line represents VUSTX with dividend adjustments. The blue line shows a return of 23.98%, when in reality the fund
returned 130.74%. That’s a whopping 106.76% difference in return!

Without accurate dividends, it is impossible to build the long-term, low volatility, low trading strategies that FastTrack is known for.

Another example is FMAGX (Fidelity Magellan), a very famous aggressive equity fund, since 9/1/1988 (the first date in the FastTrack database).

FMAGX div comparison

Again, we can see that dividends are essential to analyzing mutual funds accurately. Over the 23 year period, FMAGX appears to have posted a 38.45% gain without dividends, while accounting for dividends shows an accurate 550.92% gain over the period. Any analysis that does not account for distributions is not portraying the funds real total return. Dividend adjustment is essential for long term analysis.

In summary, FastTrack realizes the importance dividends make when assessing true total return
in investing strategies and in developing long-term trading systems. For the past 25 years the company’s mission has been to provide prompt, accurate, and comprehensive dividend adjustments. Getting an accurate view of a fund’s performance is essential to fund and ETF analysis.

Written by FT Cloud · Categorized: Data News, Strategy · Tagged: dividend adjustment, dividends, knowledge base, quality data, simple strategy

Feb 26 2014

Use Momentum to Improve Investment Returns

Introduction

Investors FastTrack and FastTrack strategies have been around for a long time and have a great track record. For 25 years we’ve been training money managers and wealthy individuals how to increase returns and reduce volatility with FastTrack products. This paper discuses a typical investors profile (derived from the years of speaking with investors), the pitfalls of the typical investor, and how to FT Cloud+ can improve the typical investor’s portfolio.

Every Investor’s Goal: Increase returns and reduce risk. FT Cloud+ uses high quality data, processing power or our server and your computer to crunch the numbers and make achieving this goal simple and fast.

A picture speaks a thousand words… Over the past 10 years a typical investor has experienced major drawdowns and lower returns than the S&P 500. FT Cloud+ has produced a fraction of the drawdowns and retained the upside of a good investing strategy. Read more below to dig into the FT Cloud+ details.

top chart
Red Line: Typical Investor
Green Line: FT Cloud+
Grey Line: S&P 500

Profile of a Typical Investor

FastTrack has been is a nexus of money mangers and wealthy individuals for the past 25 years. We’ve spoken to thousands of different investors and its safe to say the profile below is extremely accurate.

The red line in the chart above is the average investor’s portfolio. The red line is a 60/20/20 portfolio. That’s 60% S&P 500, 20% long investment grade bonds,and 20% cash, then rebalanced to those allocations at the beginning of every year. We can see it’s not a strong strategy. Its highly correlated to the S&P (99.3%), produced a 37.3% draw down, and weighs in at approximately 1.25 percent less annualized return a year compared to buying and holding the S&P.

Every week we speak to investors that hold this portfolio and claim “diversity,” but have a portfolio substantially similar to the red line above. What does it take to break out of this rut? Below we’ll look at a strategy with 4 trades a year and holding the best 4 fund of diversified family. FT Cloud+ does the heavy lifting, all you do is pull the trigger.

Improve With FT Cloud+

Be More Active To Improve Returns (But No Need to Be To Active)

As the “typical investor” analysis above shows, buy and hold isn’t a great strategy. With FT Cloud+, we’re going to make 4 trades a year, and each trade we’ll rank our family of tickers by total return and guy the top 4 tickers in the list. Its very straight forward. And, its called the “Momentum Model” because when funds are trending up, we buy them. When funds are trending down, we sell them.

The green line in the chart above is the FT Cloud+ Momentum Strategy. Its a simple strategy with 4 trades a year and always hold 4 fund at approximately 1/4 of total assets each. The power of the FT Cloud+ model is which 4 funds you hold. FT Cloud+ chooses the funds based on momentum and relative strength. Its not a black box or a fancy algorithm. Every quarter FT Cloud+ ranks a group of funds (in the green line we ranked by total return), sorts by value, and buys the top 4 funds.

More Details

Here’s how FT Cloud+ uses momentum:

  • Step 1 – Choose a diversified list of funds you might possibly want to own. For this example we used 21 Vanguard mutual funds. The list of 21 (see entire list in appendix A) is a diversified mix of plain vanilla Vanguard funds. We’ve go equities, bonds, money market, international, and commodities.
  • Step 2 – At the end of every quarter we rank the 21 funds by total return for the prior month. So, this give us a ranking of the trailing 1 month.
  • Step 3 – Sell all positions in our portfolio. Sort our ranking with the highest total return at the top. Reinvest our assets evenly among the top 4 assets in our ranking.

Summary

It pays to be a more active investor and with FT Cloud+ doing all the hard work and heavy lifting, its a straight forward and painless process.

All our strategies are easy to understand and easy to execute. And best of all… they work. There’s no need to stick with strategies producing big drawdowns, high correlations, weak performance.

Visit http://www.investorsfasttrack.com today to sign up. Use promo code “MARCHFREE” to get your free trial of FT Cloud+.

Tickers in Family

  1. VUSTX – Vanguard INV:Long-Term US Treasury
  2. VWESX – Vanguard INV:Long-Term Investment Grade
  3. VMMXX – Vanguard INV:Money Market Prime
  4. VBMFX – Vanguard INV:Total Bond Market Index Fd
  5. VFIIX – Vanguard INV:GNMA
  6. VFSTX – Vanguard INV:Short-Term Investment Grade
  7. VWEHX – Vanguard INV:Hi-Yield Corporate
  8. VGHCX – Vanguard INV:Health Care
  9. VWINX – Vanguard INV:Wellesley Income
  10. VINEX – Vanguard INV:International Explorer
  11. VGENX – Vanguard INV:Energy
  12. VTRIX – Vanguard INV:International Value
  13. VEXPX – Vanguard INV:Explorer
  14. VWUSX – Vanguard INV:US Growth
  15. NAESX – Vanguard INV:SmallCap Index Fund
  16. VEXMX – Vanguard INV:Extended Market Index Fund
  17. VMRGX – Vanguard INV:Morgan Growth
  18. VGSTX – Vanguard INV:STAR
  19. VEIPX – Vanguard INV:Equity Income
  20. VQNPX – Vanguard INV:Growth & Income
  21. VFINX – Vanguard INV:S&P 500 Index Fund

Written by FT Cloud · Categorized: Strategy · Tagged: momentum, relative strength, simple strategy, vgfullterm

Nov 04 2013

FT Rebalance vs Accutrack

Abstract:

In this discussion we will set up two popular relative strength investing strategies: FT Rebalance momentum and FT4web AccuTrack. Then we will discuss advantages of multi-fund momentum trading with FT Rebalance compared to the two fund AccuTrack strategy.

2 strategies and the benchmark

Analysis

As stated in the abstract, we’ll be comparing the FT Rebalance momentum model and the FT4web AccuTrack model. First we need to lay out the two main differences in the strategies.

1)

FT Rebalance’s is an asset allocation strategy where FT4web AccuTrack is a market timing strategy.

In simple terms, FT Rebalance’s momentum strategy will reallocate assets every quarter (Jan 1, April 1, July 1, and Oct 1). So we have 4 trades a year at the end of each quarter.

FT4web AccuTrack model will trade based on signals generated by the AccuTrack technical indicator (ie when the red fund has more strength relative to the green line: invest in the red. When the green line has more strength relative to the red line: invest in the green.)

So, FT Rebalance will reallocate to the strongest assets on preset intervals (every quarter i.e. 4 trades a year). FT4web AccuTrack will reallocate intermittently when the relative strength of the two funds cross or switch.

2)

FT Rebalance will invest in the best of three funds (VFINX, VINEX, and VIIFX). FT4web AccuTrack will invest in the best of two funds (VFINX and VINEX).

AccuTrack: The two fund strategy

AccuTrack is a popular relative strength trading strategy used by many FastTrackers. In FT4web, AccuTrack and the J chart will trade between two funds based on relative strength (find more info on AccuTrack here).

A standard relative strength strategy could be trading between a domestic fund (VFINX) and an international fund (VINEX).

FT4web screen cap
FT4web screen cap
10 year chart

In the chart above we see that the two fund model worked great during the first five years (7/2003-7/2007) with an annualized gain of 28.95%. But when the market began to turn sour in late 2007 the two fund strategy shows its major weakness: no diversity. Both international and domestic markets took a hit and as a result this strategy lost an annualized 22.10% from 7/2007 – 7/2009.

While the strategy recovered in late 2009 returning an annualized 18.21% from 7/2009 to 7/2013, the 10 years between 7/2003- 7/2013 was a quite a ride. As we see in the first chart in the post (pink line), the strategy had a max draw of 60.28 percent and an standard deviation of 5.8% (just less than the 5.94% of the S&P 500 for the same period).

FT Rebalance Momentum: Best of three funds

In the simple model illustrated below, instead of using a relative analysis of two funds, VFINX and VINEX, we added one more fund VFIIX (Vanguard GNMA) to the mix. VFIIX adds a conservative risk and low correlation fund element to our strategy.

Now, instead of moving our assets to the best of two funds, we will move our assets to the best of three funds.

accu3-stats
Red=FT Rebalance Pink=FT4web J Chart Black=S&P 500
10 year chart

As we can see in the red line above, adding one more fund to the relative analysis greatly improves long-term performance of the strategy, mainly by giving us a conservative asset like VFIIX to retreat to in down markets (all of 2008, 3Q10, 3Q11).

If we look at the period between 7/2007 and 7/2009 we have a positive annualized return of 2.22%, compared to a -22.10% return of the FT4web AccuTrack model for the same time period.

The lack of diversity hurt the AccuTrack model, as it could only choose between the VFINX and VINEX, both of which were declining in during 7/2007-7/2009. In contrast, having VFIIX as an option in the FT Rebalance momentum model, we can see that the red line smooths out during 7/2007-7/2009 as the model moves to VFIIX.

Summary

This is a very simple illustration of two different relative strength models. As the above analysis shows, incorporating more diversity (three funds vs two) into a strategy can have a strong positive impact, especially on limiting downside risk.

Additionally, we’ve seen a simple strategy that makes 4 trades a year with index style funds can have incredible results.

The next step after this would be to create a family with more than three members. Try 4, 5, or 6 well chosen, diversified funds. Also, try increasing the # to buy to 2, 3, or 4. This will increase your total number of funds held, which could temper volatility. Or, try using the sharpe model to limit the drawdowns.

Leave a comment below or email daniel@fasttrack.net with any questions

FT Rebalance Model Setup

Family:
VFINX- Vanguard S&P 500 Index Fund
VFIIX- Vanguard GNMA,
VINEX- Vanguard International Explorer
Parameters:
rebalparams
Date Range:
7/11/2003 – 7/11/2013
FT Rebalance Build:
1.5.0.8

Written by FT Cloud · Categorized: Strategy · Tagged: accutrack, ft4web, relative strength, simple strategy

Footer

Contact Us

Investors FastTrack
(866) 295-0166

Investors FastTrack © 2025