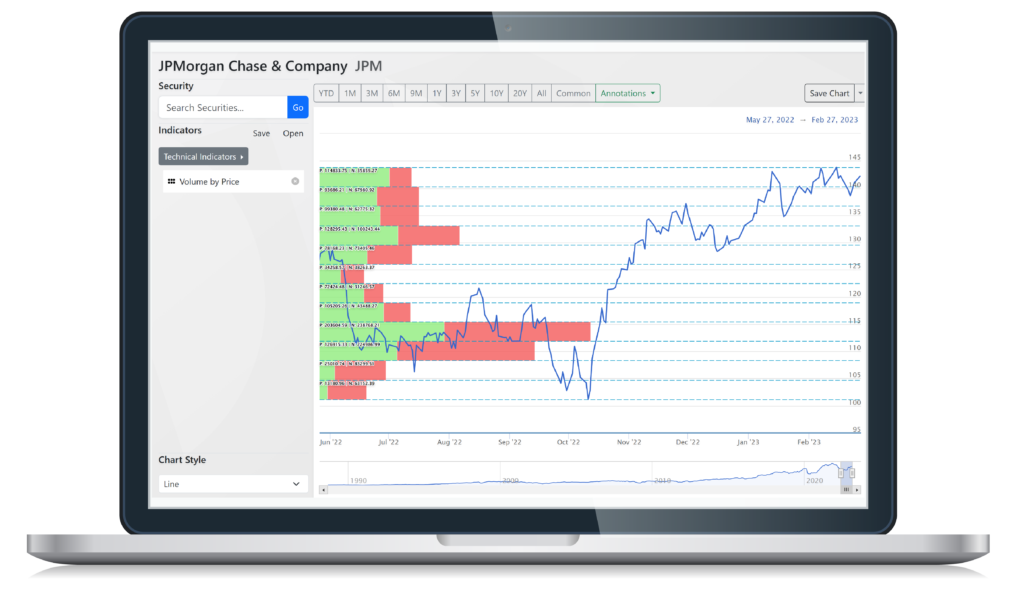
Technical Chart
Technical Indicator for securities, portfolios, and indexes.
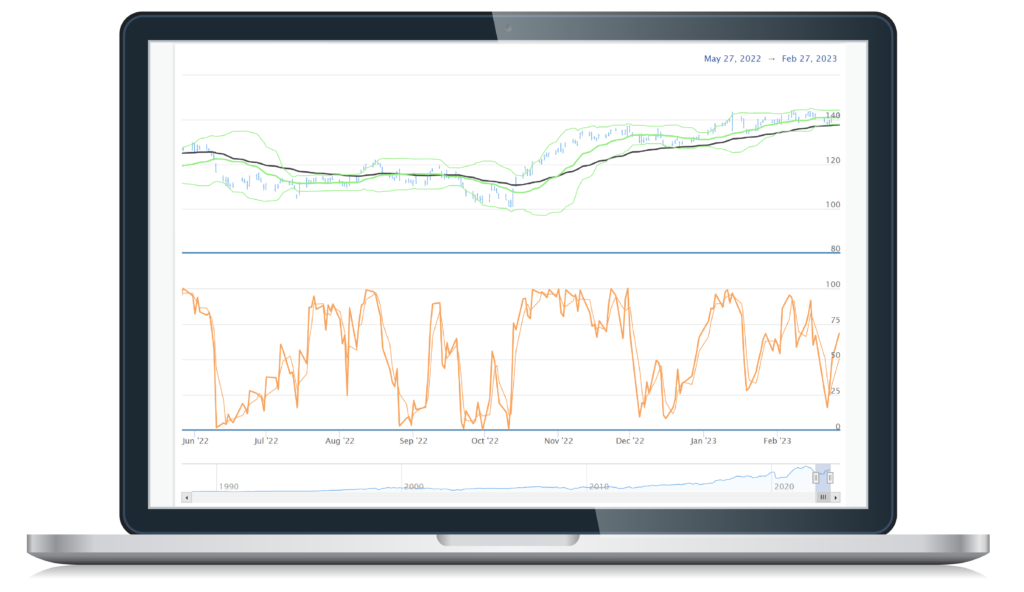
Timing Matters
Timing is critical in trading. Analyze price action, momentum, and other indicators using technical charts to determine the best time to enter or exit the market.
You can derive signals from FT Cloud, or import signals from third-party sources. The Adjusted Returns Chart in FastTrack shows the trading results based on the signals you use.
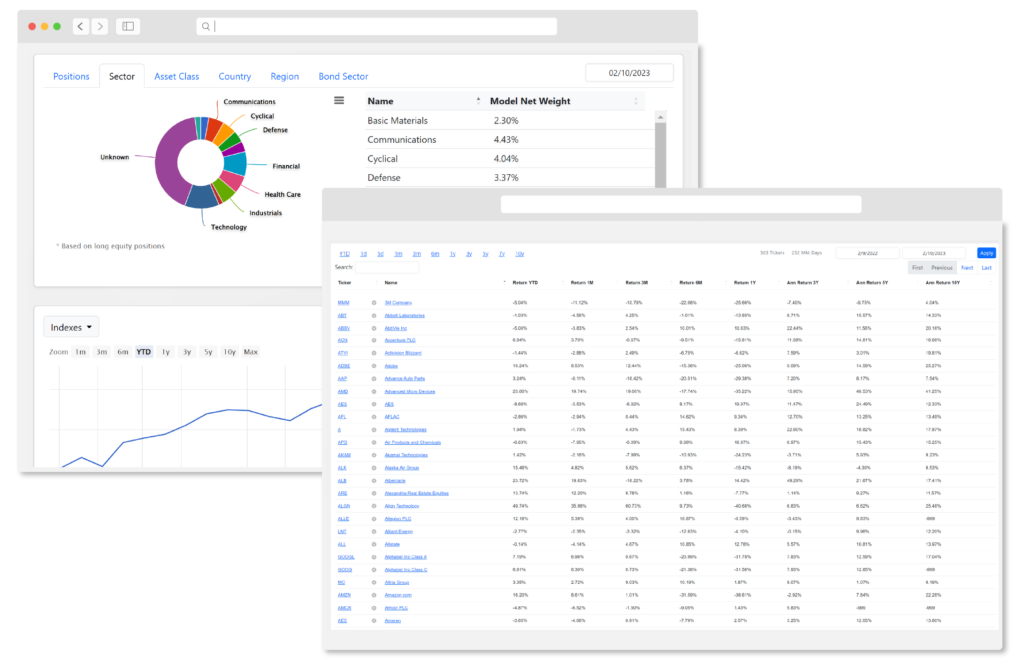
Quality and Quantity
20+ different technical charts, including popular options such as Bollinger Bands, MACD, and RSI, you can create comprehensive analyses to suit your needs.
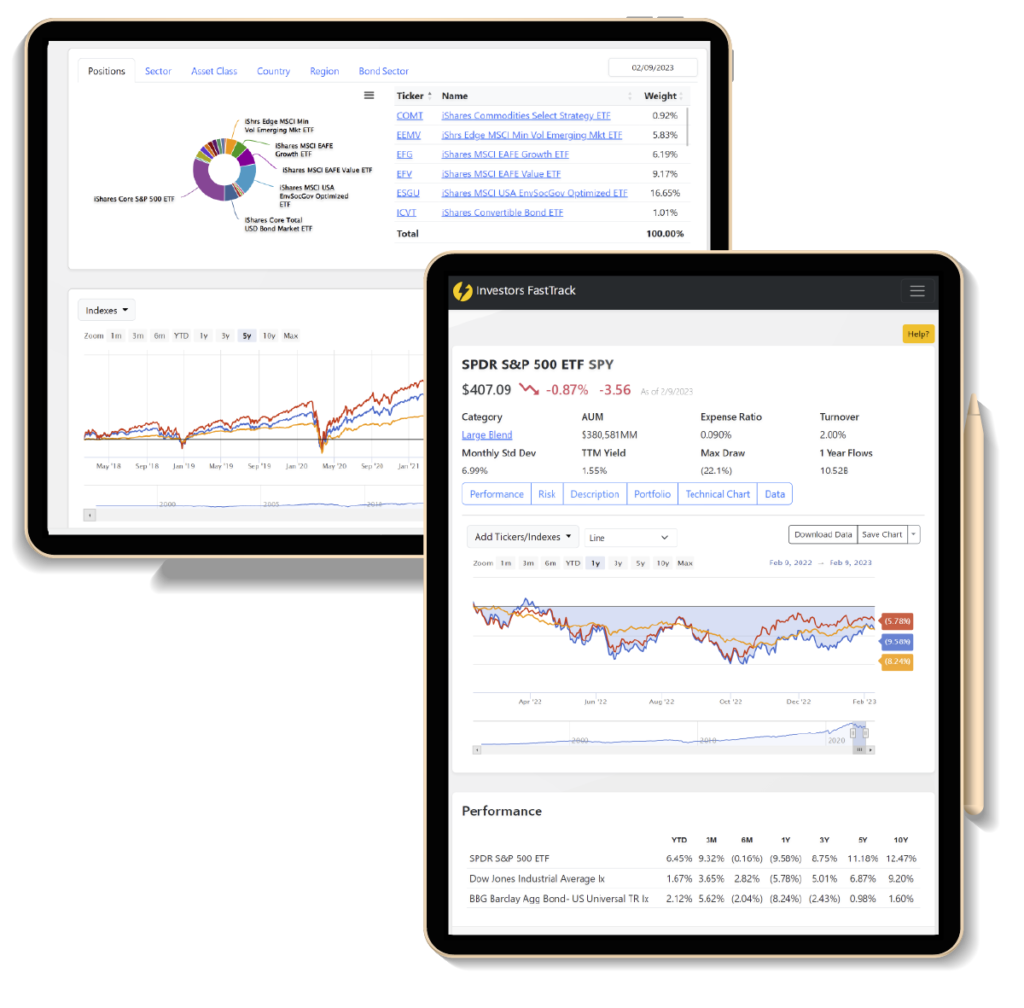
Our Technical Charts allow you to analyze and compare over 30,000 equities, ETFs, funds, and indices, PLUS your model portfolios.
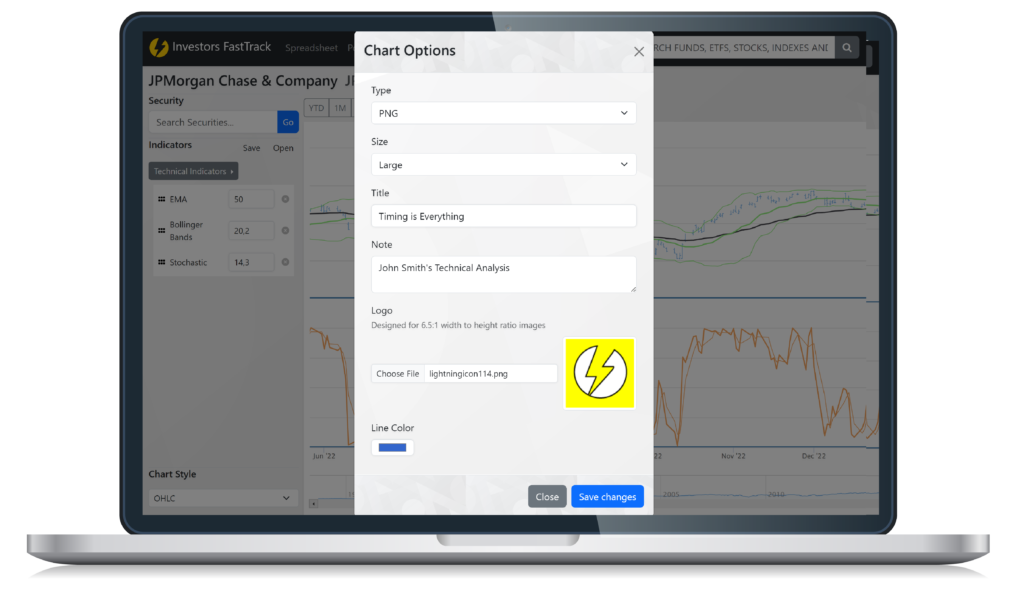
Effortlessly Share Trading Insights
Effortlessly share your insights with clients and colleagues by saving charts as images, embedding them in emails or blogs, and saving customized views for future reference.
Design with your company’s logo and colors.
Fast, Reliable, Flexible
Experience ultimate presentation flexibility by using FastTrack’s tools on any device – from your desktop to your tablet or smartphone. FT Cloud supports both Mac and Windows platforms, as well as any computer with a web browser.