Improve Communication
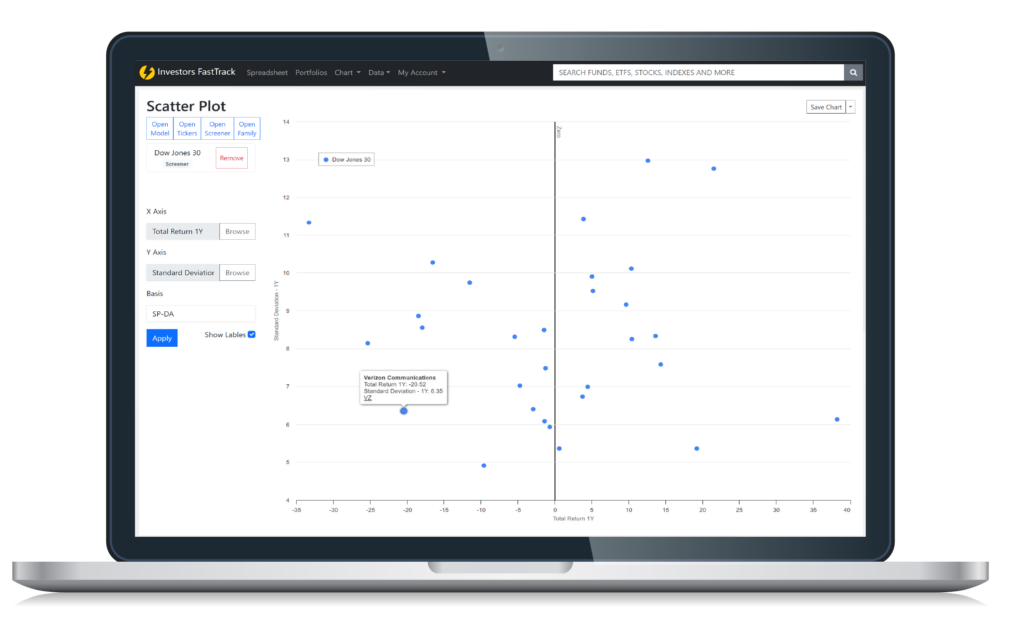
Visualize risk vs. reward profile of different securities.
Quickly assess how different securities compare to each other in terms of risk and return, making it easier to identify the best investment opportunities for your portfolio.
A picture speaks 1000 words.
Optimize Portfolios
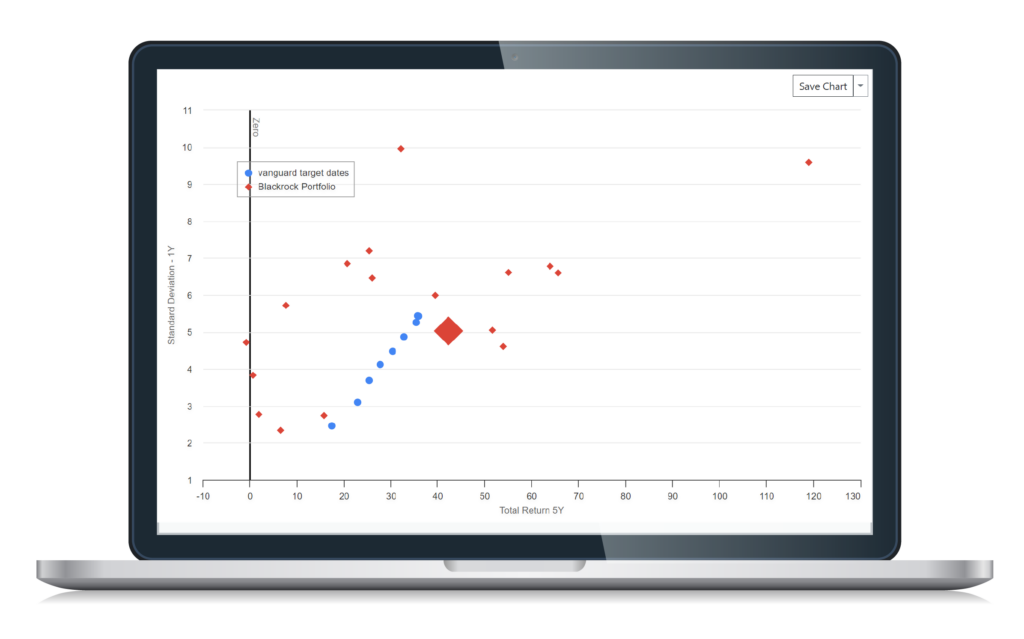
Plotting a portfolio against an efficient frontier can help investors to identify the optimal mix of securities to achieve their desired level of risk and return.
Define your efficient frontier as a set of portfolios offering the highest possible return for a given level of risk, or simply a family of target date funds.
By plotting portfolio against the efficient frontier, investors can see how their current portfolio allocation compares to the optimal allocation, and make adjustments as necessary.
Know your Winners and Losers
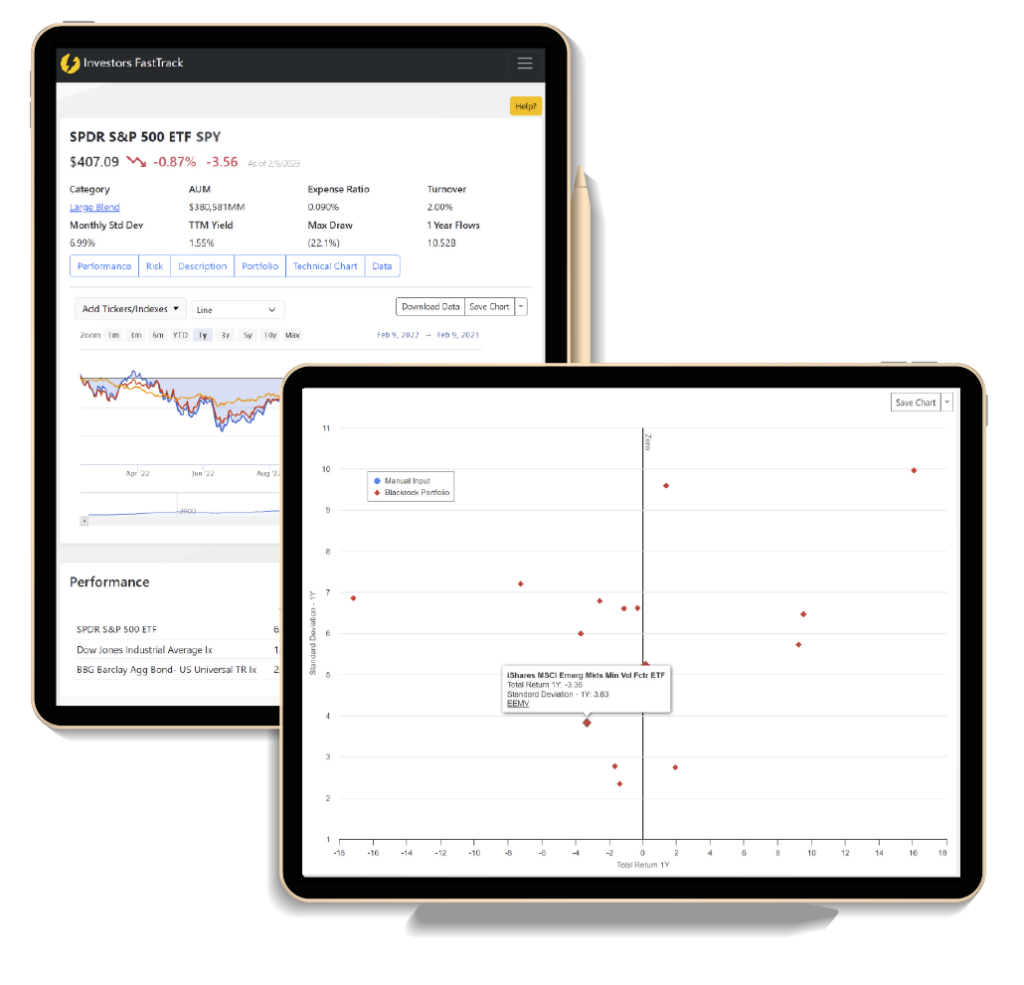
Understand how individual holdings are affecting portfolio-level metrics, such as risk and return.
Plotting individual holdings on a scatter plot and analyzing their position relative to the efficient frontier, investors can identify which holdings are contributing positively or negatively to portfolio-level metrics.
This can help investors to make informed decisions about which holdings to add or remove from their portfolio.